To open long positions on EURUSD, you need:
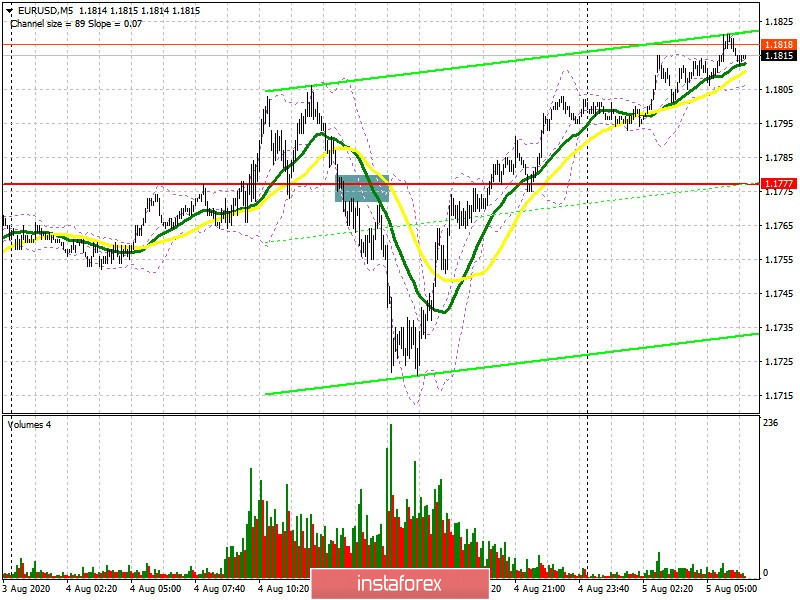
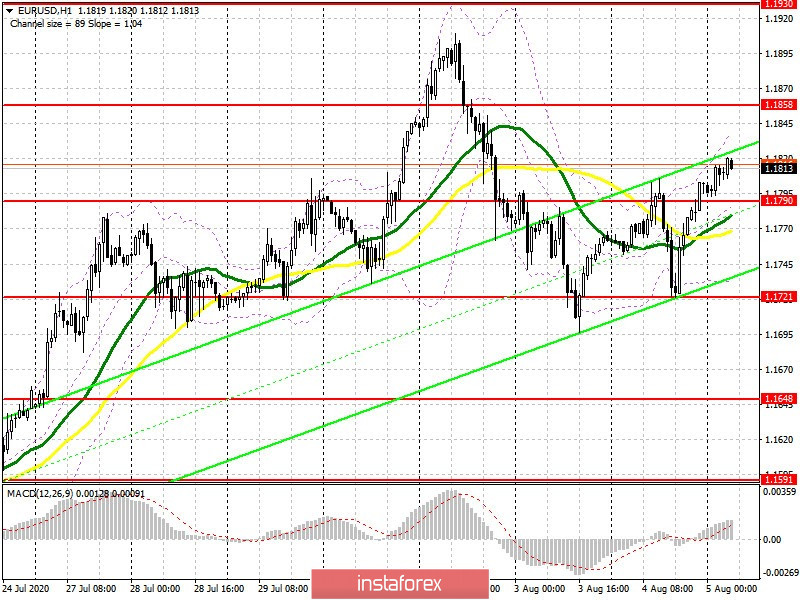
The signal that formed for buying in the morning did not bring more than 30 points of profit, but this cannot be said about sales, which could be observed at the beginning of the US session. I paid attention to them in my forecast, but let's look at this deal in more detail. If you look at the 5-minute chart, you will see how the bears still took the 1.1777 level in the afternoon, consolidating below it with the subsequent test of 1.1777 from the bottom up formed a good entry point into short positions. The movement was more than 50 points. However, it was not possible to update the previous day's lows, which indicates the return of market control over to the euro buyers. At the moment, the bulls should protect the support of 1.1790, and forming a false breakout on it will be a signal to open long positions in the hope of resuming the upward trend and breaking the high of 1.1858. However, this will happen only after good data on the services sector of the eurozone countries and the report on retail sales. Only a break and consolidation above the resistance of 1.1858 will form a new signal to buy the euro, which will open a direct path to the highs of 1.1930 and 1.1987, where I recommend taking profits. If there is not much activity among the bulls after the reports are released, it is best to postpone purchases until the support is updated at 1.1721, or open long positions immediately for a rebound from the low of 1.1648 in anticipation of a correction of 30-40 points within the day.
Let me remind you that a sharp increase in long positions and only a small increase in short ones were recorded in the Commitment of Traders (COT reports) for July 28, which tells us about the investors interest in risky assets amid confusion that is happening in the US due to the coronavirus and the presidential election. The report shows an increase in long non-commercial positions from 204,185 to 242,127, while short non-commercial positions only increased from 79,138 to 84,568. As a result, the positive non-commercial net position sharply jumped to 157,559 against 125,047 a week earlier, indicating an increase in interest in buying risky assets even at current high prices.

To open short positions on EUR/USD, you need:
Sellers already have problems that will need to be addressed after the release of eurozone reports on the services sector and retail sales. A slowdown in the indicators or significant discrepancies with forecasts for the worse will slow down the bullish momentum. To do this, sellers of the euro need to return to the 1.1790 level, since only a consolidation below this range will increase pressure on the pair and lead to an update of yesterday's low in the 1.1721 area, where I recommend taking profits. The long-term goal is still the 1.1648 area, the test of which will indicate the resumption of the bearish trend. If EUR/USD continues to grow after the data on the eurozone, it is best not to rush to short positions, and wait until a false breakout forms in the resistance area of 1.1858. I recommend selling the euro immediately for a rebound only from the new high of 1.1930, based on a correction of 30-40 points within the day.

Indicator signals:
Moving averages
Trading is carried out just above the 30 and 50 moving averages, which indicates the bulls' attempt to take the market under their control.
Note: The period and prices of moving averages are considered by the author on the H1 hourly chart and differs from the general definition of the classic daily moving averages on the daily D1 chart.
Bollinger Bands
A breakout of the upper border of the indicator around 1.1850 will lead to a new wave of euro growth. The fall will be limited by the lower level of the indicator in the area of 1.1721.
Description of indicators
- Moving average (moving average, determines the current trend by smoothing out volatility and noise). Period 50. It is marked in yellow on the chart.
- Moving average (moving average, determines the current trend by smoothing out volatility and noise). Period 30. It is marked in green on the chart.
- The MACD indicator (Moving Average Convergence/Divergence — convergence/divergence of moving averages). Fast EMA period 12. Slow EMA period to 26. The 9 period SMA.
- Bollinger Bands (Bollinger Bands). The period 20.
- Non-commercial speculative traders, such as individual traders, hedge funds, and large institutions that use the futures market for speculative purposes and meet certain requirements.
- Long non-commercial positions represent the total long open position of non-commercial traders.
- Short non-commercial positions represent the total short open position of non-commercial traders.
- The total non-commercial net position is the difference between short and long positions of non-commercial traders.


