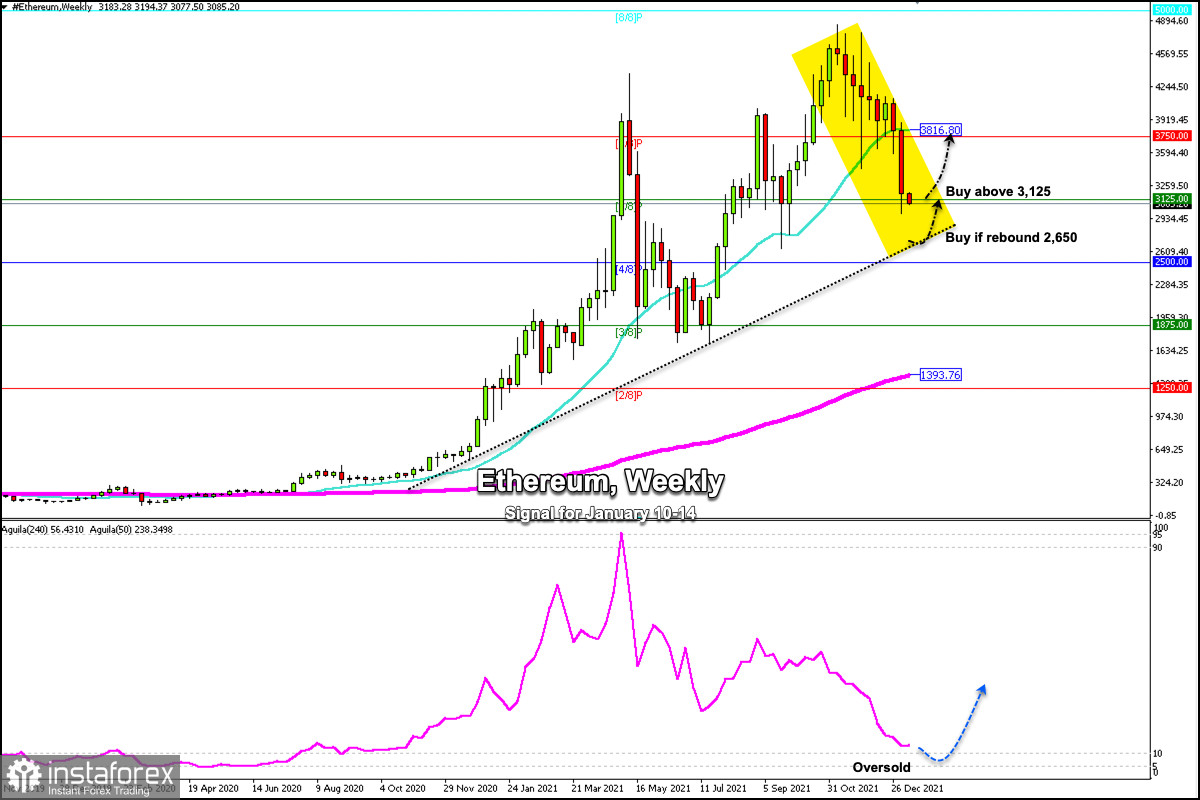
According to the weekly chart of ETH/USD, Ethereum has been moving in a strong upward trend since October 4, 2020. It is now located below the SMA at 21 (3,816) and around the range zone of 3/8 Murray at 3,125.
Minutes of the US FOMC meeting released on Wednesday showed that the regulator is willing to increase the pace of reducing bond purchases and raise the interest rate as soon as possible, causing the dollar to rise and cryptocurrencies to fall.
Amid this fundamental data, Bitcoin and Ethereum are likely to remain under downward pressure in the long term.
Any technical bounce in the next few days will be seen as an opportunity to sell. If the US Fed increases the interest rate, it is likely that Bitcoin will have a sharp fall, and Ethereum, in turn, may reach the levels of July 18, 2021 at 1,875.
According to the weekly chart, the Eagle indicator registered a strong overbought signal since May 2021, but then the trend changed giving a bearish signal. It is now approaching oversold levels and a technical bounce is expected in the next few days around 3,125. If it hits the bottom of the uptrend channel around 2,650, targets will lie at the zone of 6/8 Murray at 3,750.
Our trading plan for the next few hours is to buy Ether above the 5/8 Murray and our target will be at the resistance of 3,816 (21 SMA). Conversely, as long as it remains below the psychological 3,000 level, a drop towards the support 2,650 could occur and up to the key level of 4/8 Murray at 2,500.
Support and Resistance Levels for January 10 - 11, 2022
Resistance (3) 3,393
Resistance (2) 3,241
Resistance (1) 3,125
----------------------------
Support (1) 2,936
Support (2) 2,812
Support (3) 2,500
***********************************************************
Scenario
Timeframe 4-hours
Recommendation: buy above
Entry Point 3,125
Take Profit 3,500, 3,818 (21 SMA)
Stop Loss 3,000
Murray Levels 3,125 (5/8), 3,750 (6/8)
***********************************************************


