


Bitcoin made a new lower low yesterday around $39,500 very close to our $38,000 target. Price remains in a bearish trend, the RSI has started providing us with bullish divergence signals in the 4 hour chart but not in the daily.
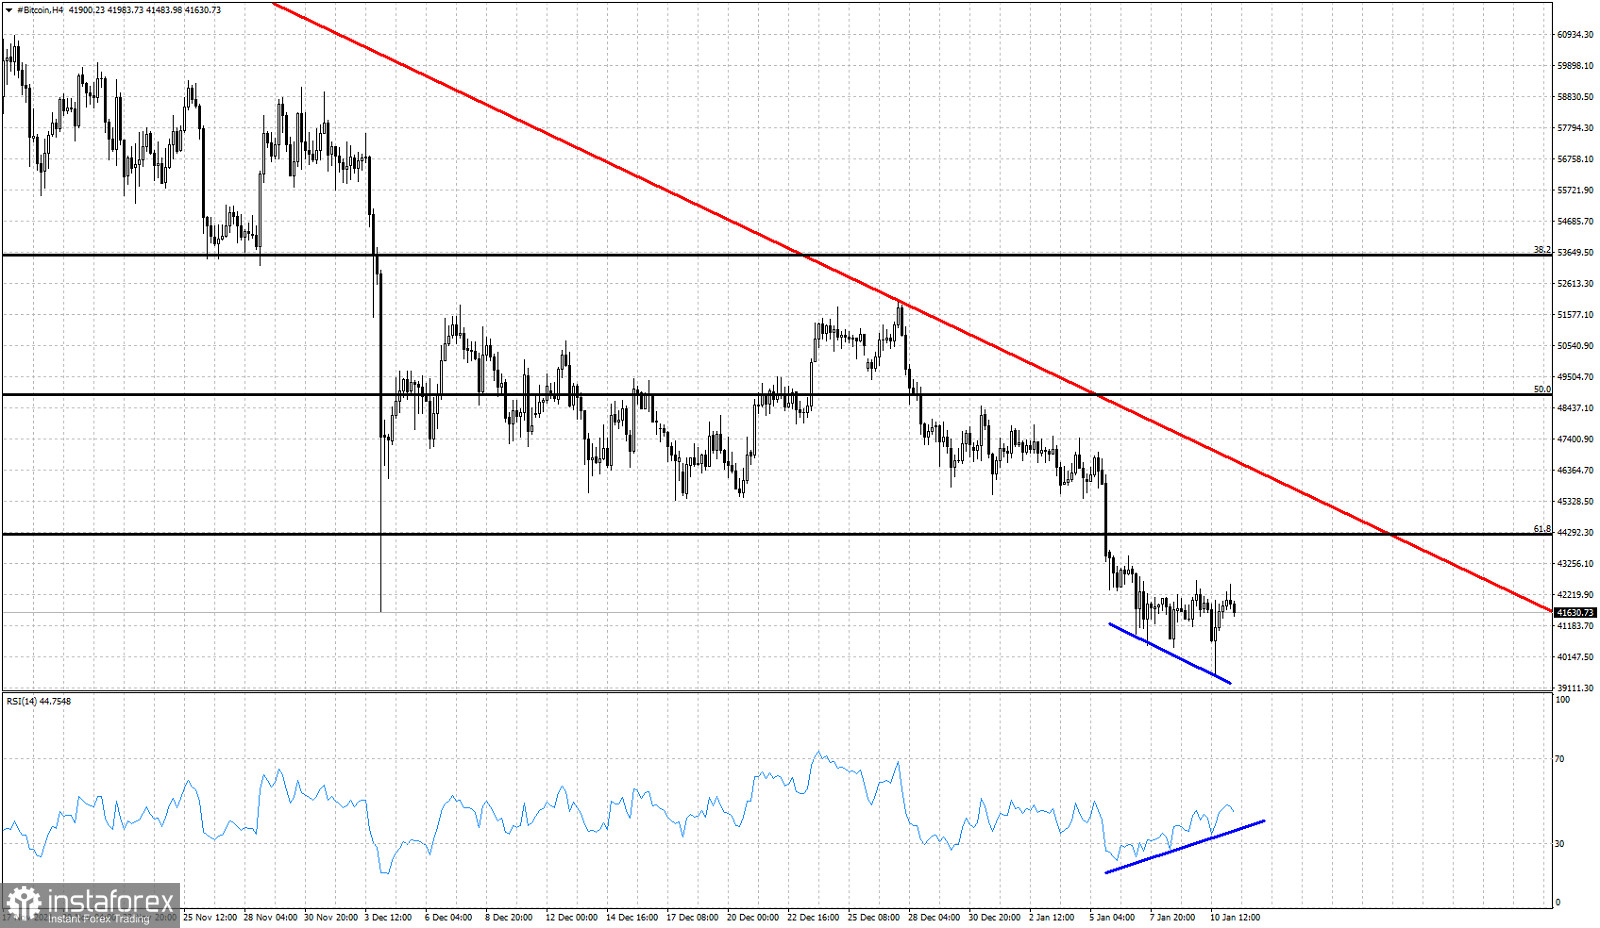
Blue lines -bullish divergence
The intraday chart shows that the downside is limited for Bitcoin. An upward bounce towards the red resistance trend line at $45,000 is very possible, because of the RSI bullish divergence. Price has reached very close to the 78.6% Fibonacci retracement of the entire rise. Breaking below it will be something bulls do not want to see. On the other hand, bears do not want to see price break above the red downward sloping resistance trend. Although a bounce is justified from current levels, bears remain in control of the short-term trend.


