


GBPUSD bulls have managed to reclaim 1.36 and have reached as high as 1.3644. Technically short-term trend remains bullish as price continues making higher highs and higher lows. In our previous posts however, we warned that a reversal is imminent because price is trading at a major resistance area.
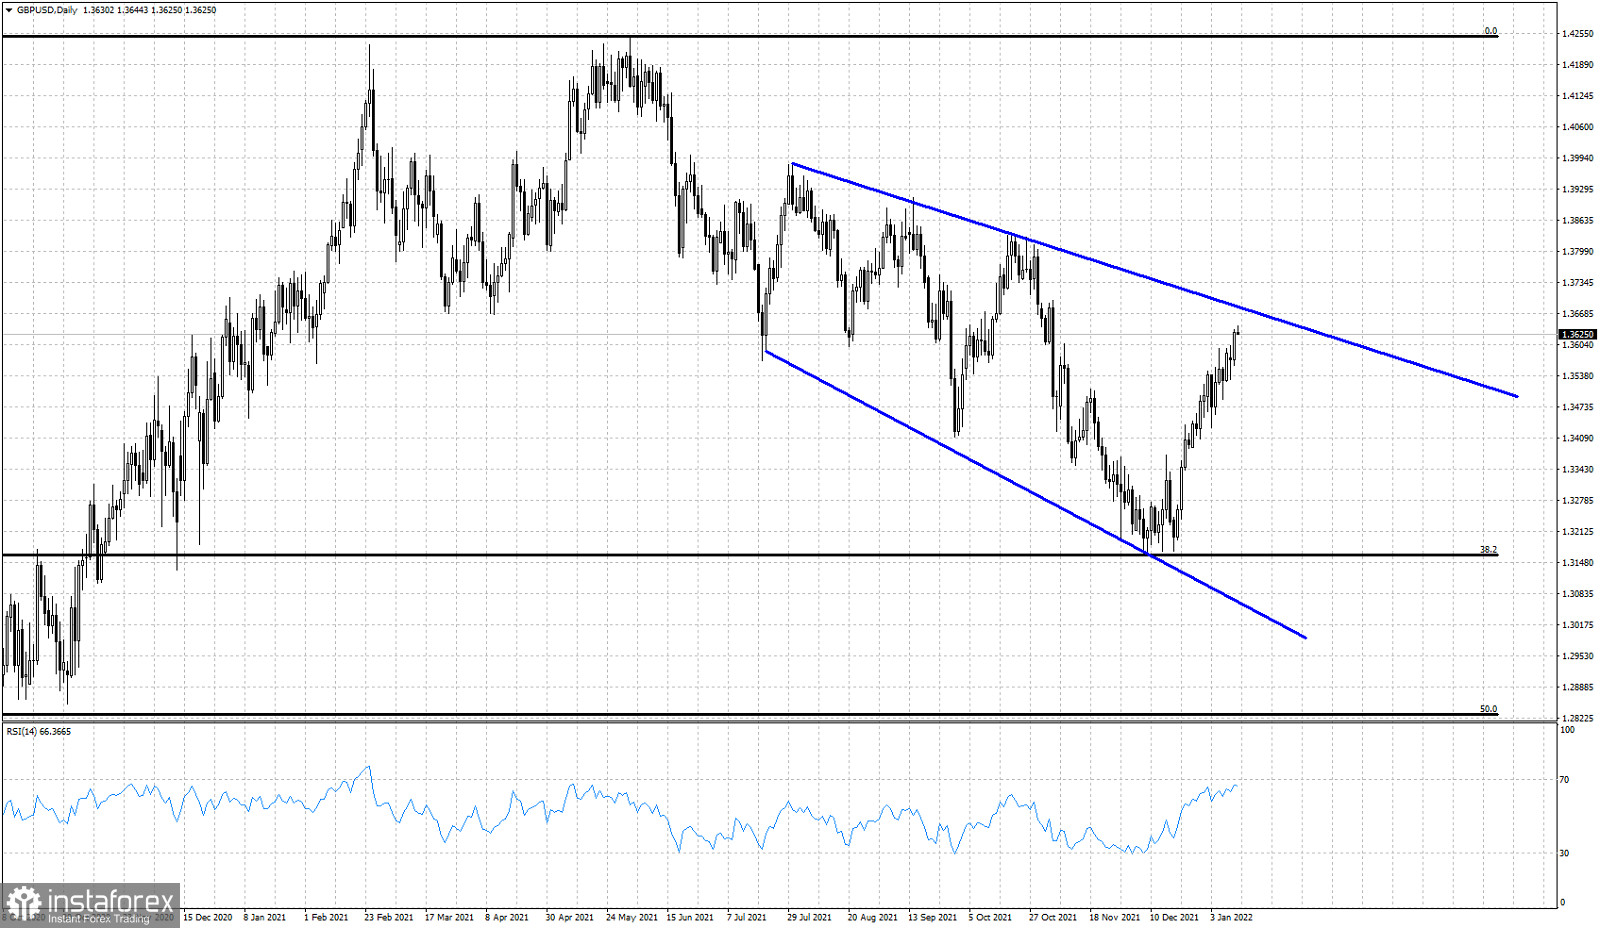
Black lines -Fibonacci retracement
Blue lines- expanding wedge pattern
GBPUSD has bounced strongly as expected from the 38% Fibonacci retracement and support level at 1.3165. Price is now approaching the upper wedge boundary. At 1.3689 we find the 78.6% Fibonacci retracement of the decline from 1.3832 to 1.3167. At 1.37 we find the 50% Fibonacci retracement level of the decline from 1.4247. Concluding, there is a cluster of major Fibonacci levels around this area. On a daily basis however, there is no confirmation of a reversal yet.
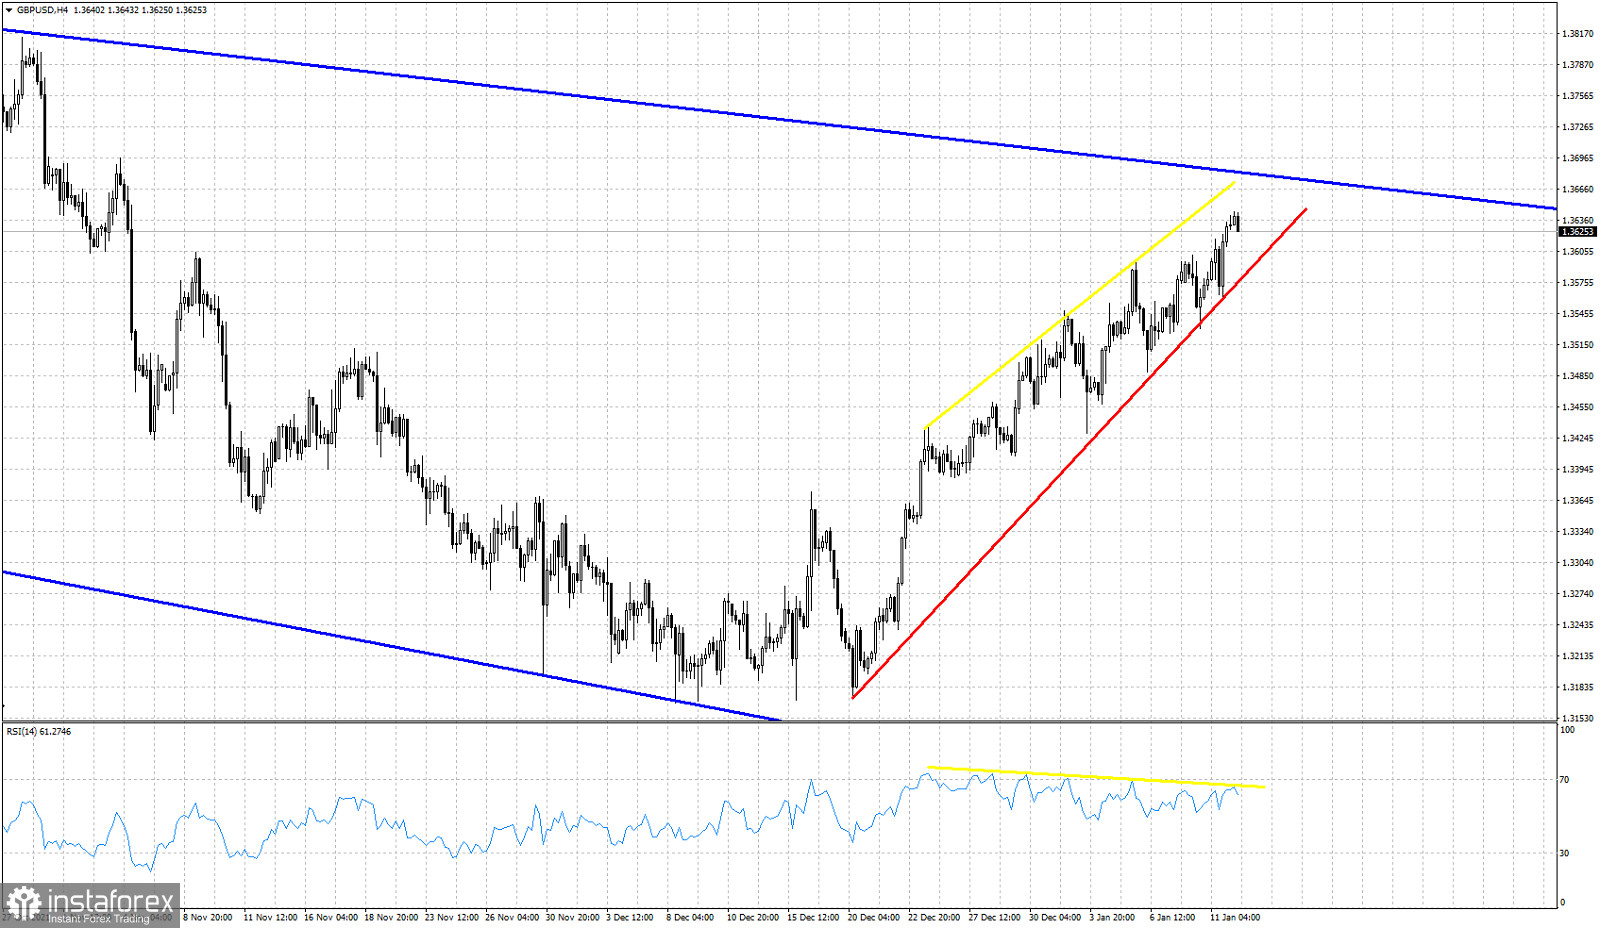
Red line -support trend line
Yellow lines- RSI bearish divergence
As we mentioned above, trend is bullish in the near term as price continues making higher highs and higher lows. However the RSI in the 4 hour chart is giving us an important warning signal that should not be ignored. The RSI has been making lower highs for some time now, increasing the chances of a reversal. This will be confirmed when price breaks below the red upward sloping support trend line. This confirmation will come if price breaks below 1.3580. Although trend remains bullish, I expect a reversal to be seen soon. I believe upside potential is limited.


