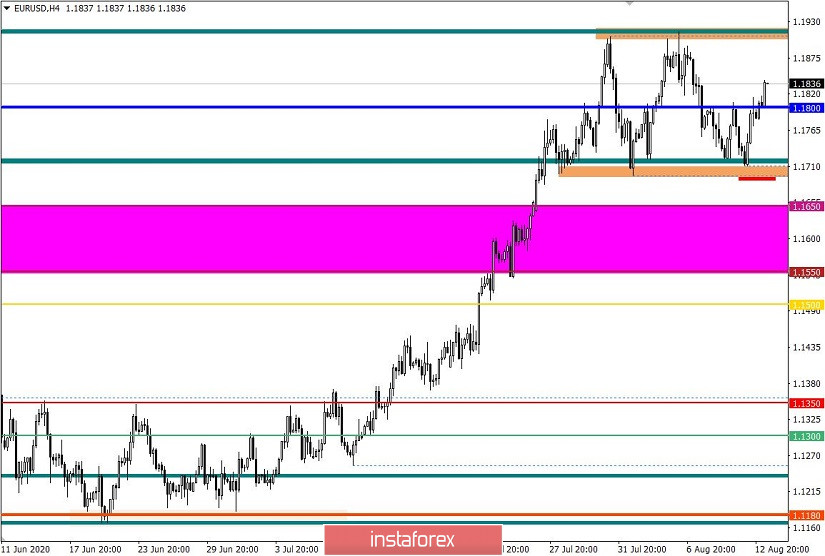
The EUR/USD pair continues to follow the trajectory of the side channel 1.1700 / 1.1910, where once again the area of 1.1700 / 1.1720 played the role of support, returning the quote above the level of 1.1800.
The area of 1.1700 / 1.1910 was a platform for unloading long positions, which since the beginning of July have been able to amass mega profits.
However in this situation, one factor worries market participants. This is the characteristic oversold of the US dollar. Trading in a flat is good as it brings stabilization, but when the dollar is being sold throughout the Forex market, it becomes uncomfortable, especially when even fundamental analysis cannot change the situation.
In addition, it suggests that Wall Street is playing a game in which at one point or another, a sharp increase in the US dollar will occur, which will lead to significant changes in the EUR and GBP rates, which are now overbought.
Nonetheless, analyzing the last trading day by minutes, we can see that the round of long positions appeared at the start of the European session, during which the quote returned to a price level of 1.1800.
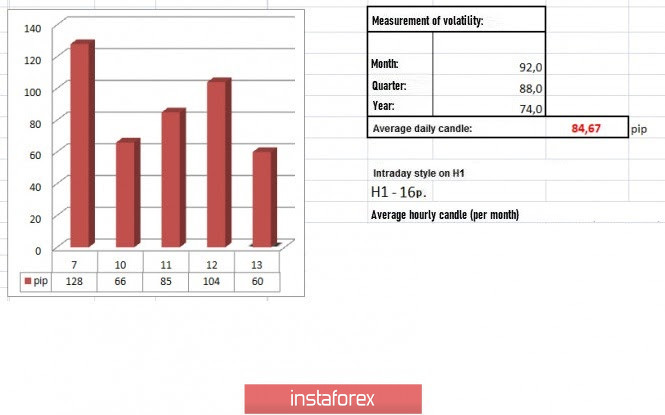
It gave a volatility of 104 points, which is 23% higher than the average value. And, compared with the GBP/USD pair, the EUR/USD pair surpasses in terms of volatility, which is considered not a typical phenomenon and indicates a high level of speculation.
[Check out the forecast for the GBP/USD pair here]
Just as discussed in the previous review, traders worked on a breakout from the limits 1.1700 / 1.1910, which made it possible to determine the direction of movement.
Thus, in the daily chart, a slowdown in movement can be seen, as well as a change in the range of the flat.

The news published yesterday included data on industrial production in Europe, where the rate of decline slowed down from -20.4% to -12.3, while the forecast was -12.0%.
Even though it was just a slight deviation from forecasts, it still prevented the euro from keeping the upward movement in the market.
Meanwhile, the key event of the day was the data on US inflation, which recorded the highest growth rate since 1991. Consumer prices rose by 1% in July in annual terms, slightly better than the expected 0.8%. In monthly terms, inflation was at 0. 6%, which coincides with the high in 1991.
The rise was caused by a rebound in demand for goods and services, which collapsed at the beginning of the year due to the quarantine measures.
It was a big surprise that the oversold US dollar did not react to such positive statistics, and suggests that large players are manipulating the market.
Nonetheless, Boston Fed president Eric Rosengren again expressed his pessimistic expectations regarding the prospects for economic recovery in the United States.
"Limited or inconsistent attempts by states to take control of the coronavirus not only put citizens at unnecessary risk of contracting a serious illness and possibly death, but will also contribute to prolonging the economic crisis," Rosengren said.
According to him, unemployment in the US will decline more slowly than expected, mainly due to the likely worsening of the epidemiological situation in several states.
In the meantime, data on weekly claims of unemployment benefits in the US will be published today, the forecast for which is a decline from 1,186,000 to 1,150,000 in initial claims, while a drop from 16,107,000 to 15,800,000 is expected for repeated claims.
Further development
Analyzing the current trading chart, we can see that the quote consolidated above 1.1800 during the Asian session, which led to a mix of price fluctuations from the lower part of the flat to its upper part. Holding the upward turn and fixing the quote higher than 1.1800 may well lead to a movement towards 1.1860-1.1890, where the second value is already the level of the flat's upper limit.
However, an alternative scenario may develop, if the price decelerates from the current values. It will return the quote below a price level of 1.1800, after which it will move towards 1.1700 / 1.1800.

Indicator analysis
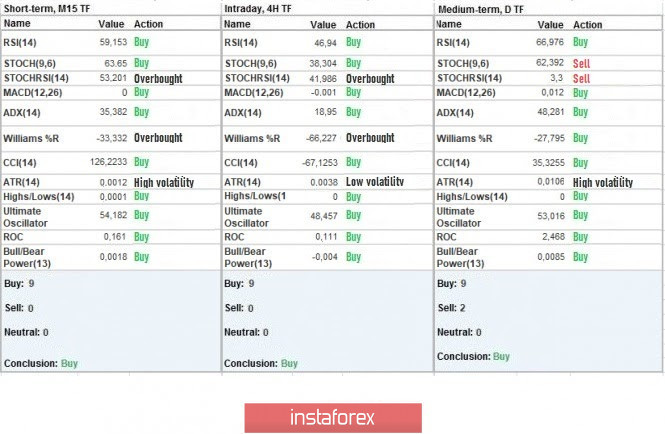
Analyzing the different sectors of time frames (TF), we can see that the indicators of minute and hourly periods signal "buy" due to a consolidation of quotes above 1.1800.
Meanwhile as before, the daily period signals "buy", but in order to change it, the quote must consolidate below 1.1690.

Weekly volatility / Volatility measurement: Month; Quarter; Year
The measurement of volatility reflects the average daily fluctuation, calculated per Month / Quarter / Year.
(August 13's was built, taking into account the time this article is published)
Volatility is currently 60 points, which is 28% below the average daily value. Market activity is already rising at the moment, so it is possible that volatility will again exceed the average level in terms of dynamics.
Key levels
Resistance zones: 1,1900 **; 1.2000 ***; 1.2100 *; 1.2450 **.
Support Zones: 1,1800; 1.1650 *; 1,1500; 1.1350; 1.1250 *; 1.1.180 **; 1.1080; 1.1000 ***; 1.0850 **; 1.0775 *; 1.0650 (1.0636); 1.0500 ***; 1.0350 **; 1.0000 ***.
* Periodic level
** Range level
*** Psychological level
Also check the brief trading recommendations for the EUR / USD and GBP/USD pairs here.


