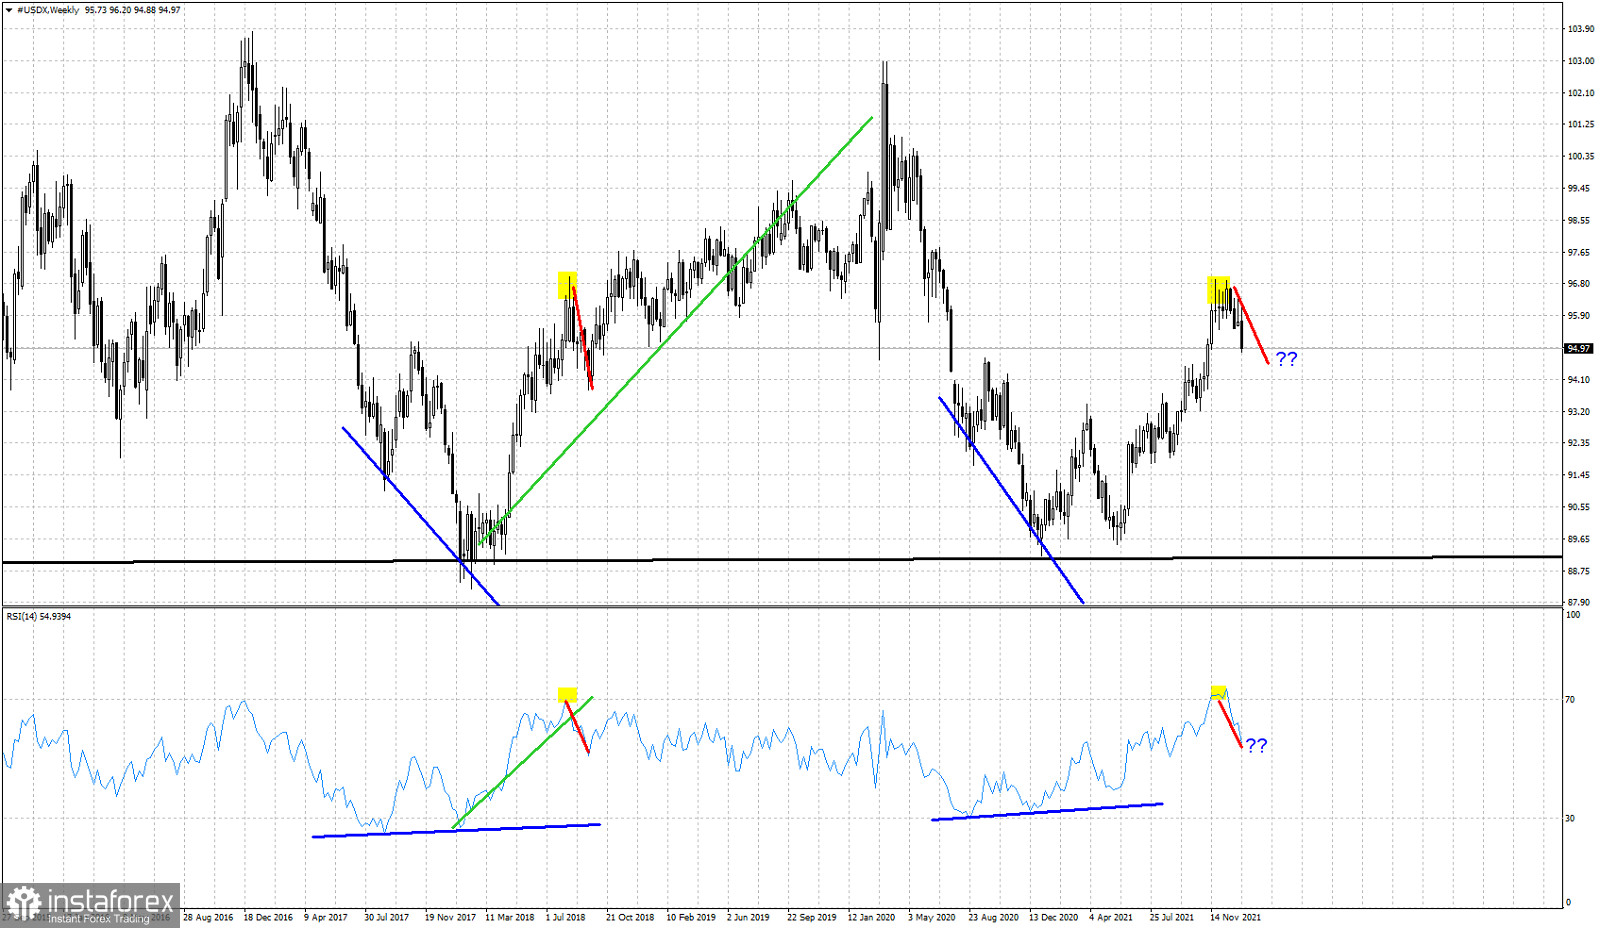
Around December 12th when the Dollar index was trading around 96.30 we posted an analysis showing the similarities of the current market conditions and similarities with price at 2018 and how it lead to a pull back.

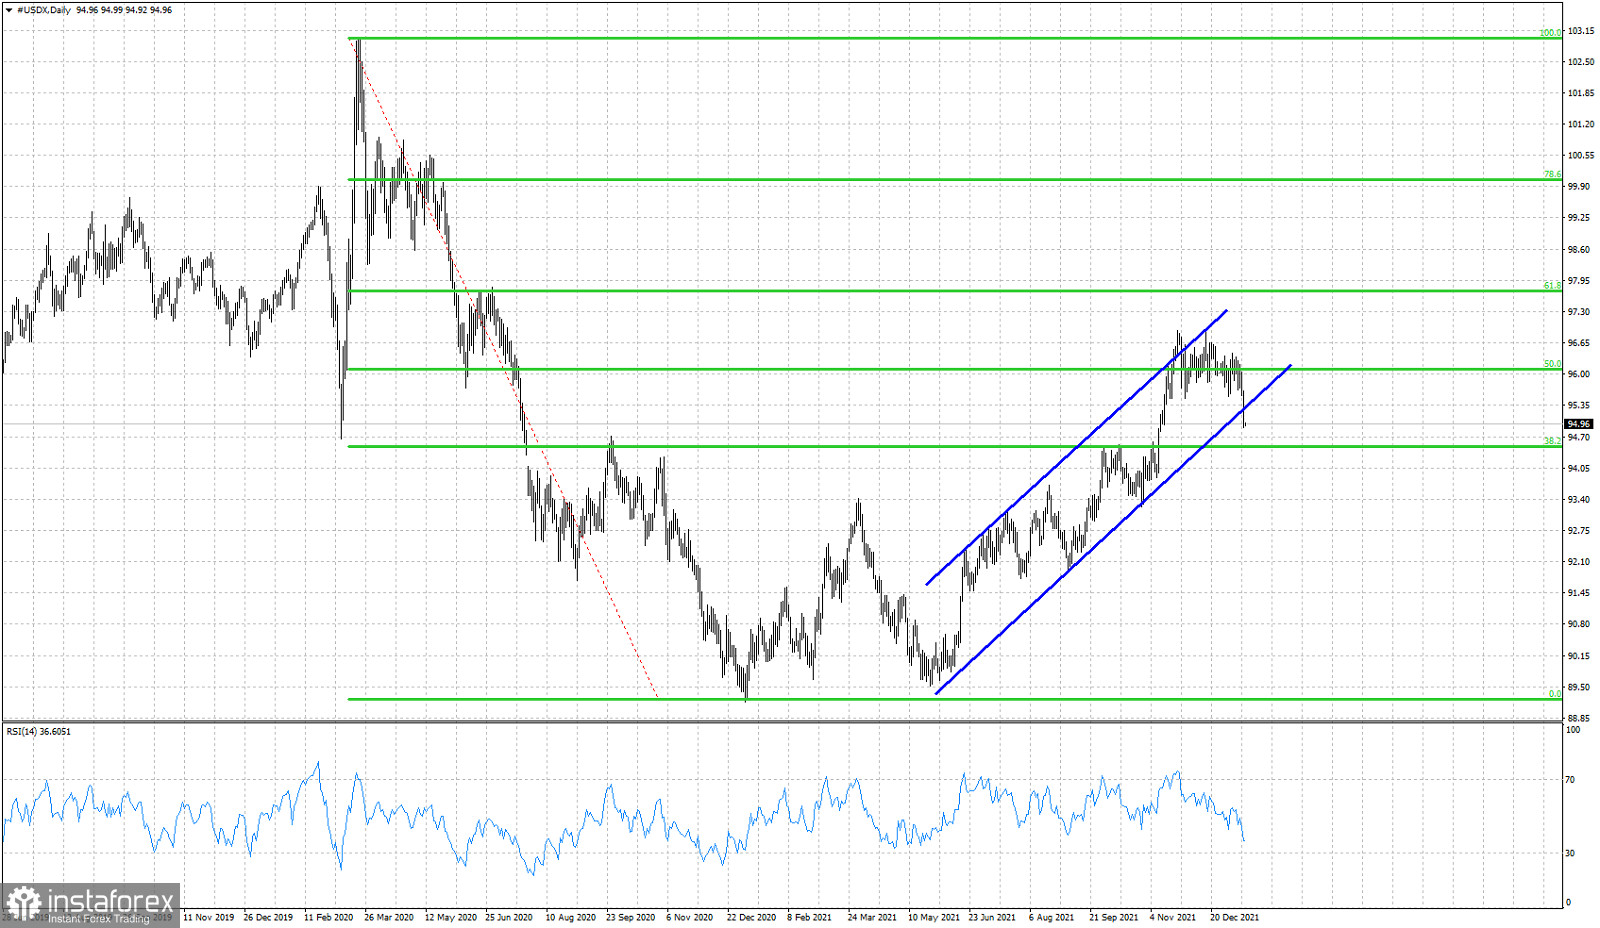
Green lines- Fibonacci retracements
This week the Dollar index broke out of the bullish short-term channel and below 95. Next support is found at the previous resistance (38% Fibonacci retracement) at 94.50. Price is under pressure and we expect this level to be challenged. It is too soon to tell if the entire upward move from 89-90 is complete and another leg lower is starting.

Red lines - expected path
The Dollar index is following the 2018 analogy thus far. Price has turned lower as expected and the RSI has provided us again with another topping signal with the reversal below the 70 level. In 2018 the pull back from the short-term top lasted around 5-6 weeks. We are currently in the 4th week from the nearest top. Support is found at 94-94.50 area. If we are to experience 2018 again, we should see price form a higher low in that area and then turn upwards.


