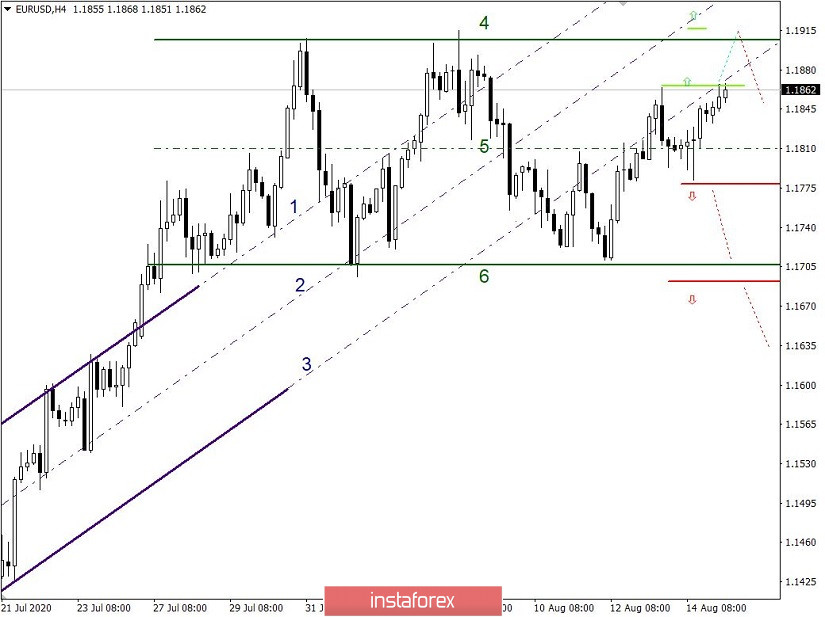
The EUR/USD currency pair has been following the course of the side channel 1.1700 // 1.1810 // 1.1910, (6 + 5 + 4, lines) for 15 trading days, consistently working out the set boundaries. The upper part of the channel 1.1810/1.1910 has become the most interesting for market participants since August 13, when the quote managed to consolidate above line No. 5 (area 1.1810). Holding the price above the level of 1.1810 may lead to another touch of line No. 6 (area 1.1910), thereby completing the cycle of movement from line No. 6 to line No. 4.
Based on the price fixing points with respect to the side channel, a number of possible market development scenarios can be obtained:
The first is the completion of the cycle of the move from line 6 to line 4.
In this outcome, the quote must be consolidated above 1.1870, which will lead to a movement towards line No. 4 (1.1910 area).
The second is the price return to the lower part of the 1.1700/1.1810 channel.
The existing price fluctuation does not bring the quote to line No. 4 (area 1.1910), but returns it to line No. 5 (area 1.1810), which leads to a reverse movement in the lower part of the side channel 1.1700 / 1.1800.
The third is a breakdown of line No. 4 or No. 6.
The main trading method is based on the tactics of breaking through the established boundaries of the side channel 1.1700 // 1.1810 // 1.1910, which will make it possible to predict the course of the market for the coming days.
Buy deals - consolidate the price above 1.1925.
Sell deals - consolidate the price below 1.1690.

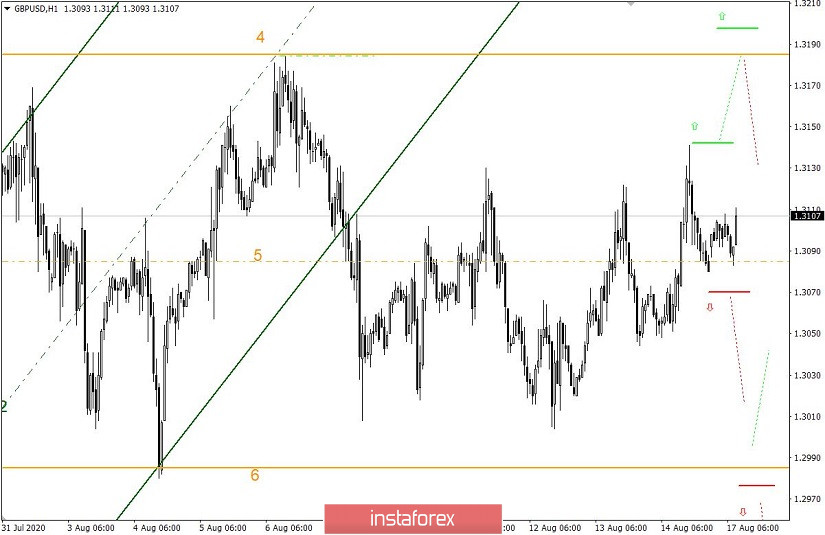
The GBP/USD currency pair is moving along a similar course of sideways fluctuations within the boundaries of 1.2985 // 1.3085 // 1.3185 (# 6; 5; 4), where the level of 1.3085 has recently become the most focused coordinate. A movement along the middle line of the channel indicates indecision of market participants, but at the same time, prepares the market for the upcoming acceleration. The strategy of work on the price rebound from lines No. 4 and No. 6 is considered relevant until the borders of the channel are broken.
Based on the side channel data available, a number of market development scenarios can be obtained:
The first is the price movement in the direction of line No. 4.
In this case, we consider the price movement along the course 1.3145 -> 1.3185, where the second value reflects the upper border of the channel.
The second is the price movement in the direction of line No. 6.
In this case, the price movement is considered along the course 1.3070 -> 1.3000, where the second value reflects the area of the lower boundary of the channel.
The third is a breakdown of line No. 4, or No. 6
In this case, we are talking about the completion of the amplitude of the side channel 1.2985 // 1.3085 // 1.3185, where the main strategy is aimed at identifying price fixing points outside one or another border, which will make it possible to predict the further course of the market.


