


The market may continue to move downward from the level of 1.1840 (closing of yesterday's daily candle) with the target at 1.1780 - a 23.6% pullback level (red dotted line). Upon reaching this level, the price may continue to move down with the next target at the support level 1.1705 (black thick line).
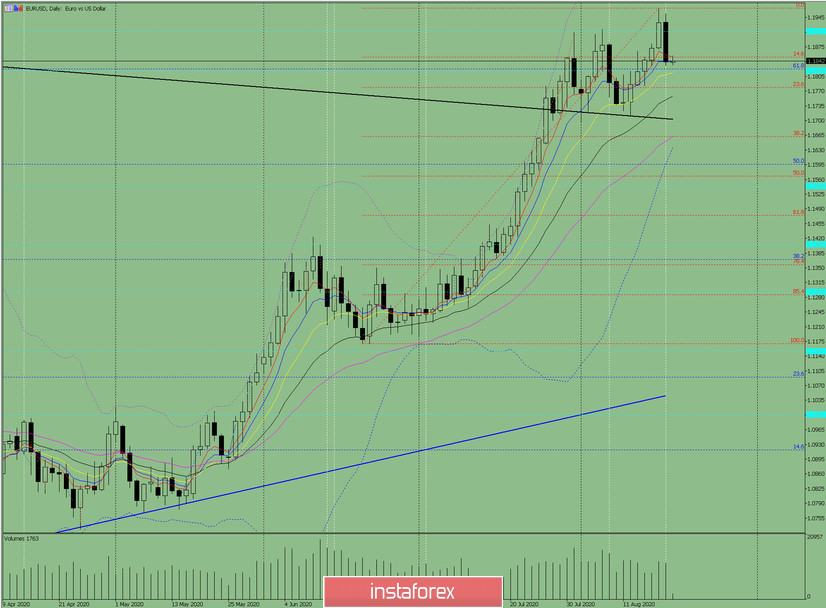
Figure: 1 (daily chart).
Comprehensive analysis:
- Indicator analysis - down;
- Fibonacci levels - down;
- Volumes - down;
- Candlestick analysis - down;
- Trend analysis - down;
- Bollinger lines - up;
- Weekly chart - down.
General conclusion:
Today, the price may continue to move downward from the level of 1.1840 (closing of yesterday's daily candle) with the target at 1.1780 - a 23.6% pullback level (red dotted line). Upon reaching this level, the price may continue to move down with the next target at the support level 1.1705 (black thick line).
Another possible scenario is after testing of the historical resistance level of 1.1819 (blue dotted line), the price may move upward with the target at the upper fractal 1.1967 (red dotted line).


