


To open long positions on EURUSD, you need:
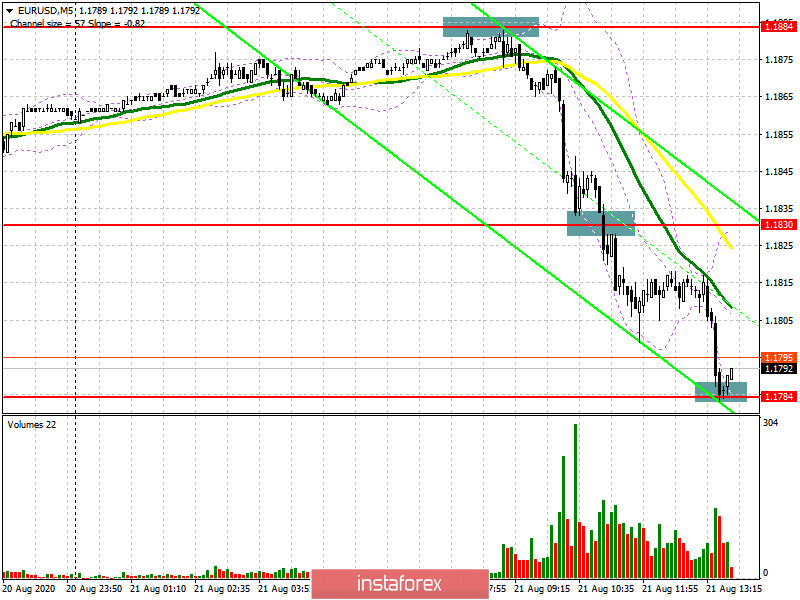
Data that would seem to help the euro further strengthen its position against the US dollar, on the contrary, led to a sharp collapse of the pair in the first half of the day. The values were much worse than the forecasts of economists, and in some countries, there was a decrease in activity in the service and manufacturing sectors. Unfortunately, it was not possible to wait for the formation of a false breakout from the level of 1.1884 in the first half of the day, and as you can see on the 5-minute chart, several resistance tests of 1.1884 could not form a signal to sell the euro. Already breaking through the support range of 1.1830 and then fixing under it, where there was a temporary stop of the first wave of the euro's fall, formed a good entry point into short positions, which led to a decrease to the low of 1.1784. At the moment, the bulls are active in this range, from which in the morning I recommended opening long positions immediately on the rebound, which can lead to a small movement of the pair up by 20-30 points. In the scenario of a repeated decline in EUR/USD to the area of 1.1784, it is best to postpone long positions until the update of the minimum of 1.1746, a fall to which may occur after the release of good fundamental data on the US economy. An equally important task for the bulls in the second half of the day will be to regain the resistance of 1.1830. Fixing at this level will be a good buy signal in the expectation that the pair will return to the opening area of the day and update the maximum of 1.1884, where I recommend fixing the profit.
To open short positions on EURUSD, you need:
The bears have already come a long way in the first half of the day and achieved a support test of 1.1784, which will not be easy to break below. Only good fundamental data on the activity of the US PMI indices will lead to a consolidation below this range and a further sell-off of EUR/USD to the area of lows 1.1746 and 1.1714, where I recommend fixing the profits. If the demand for the euro returns in the second half of the day, a safer scenario will be sales if a false breakout is formed in the resistance area of 1.1830. I recommend opening short positions immediately for a rebound only from the maximum of 1.1884, counting on a correction of 30-40 points within the day.
Signals of indicators:
Moving averages
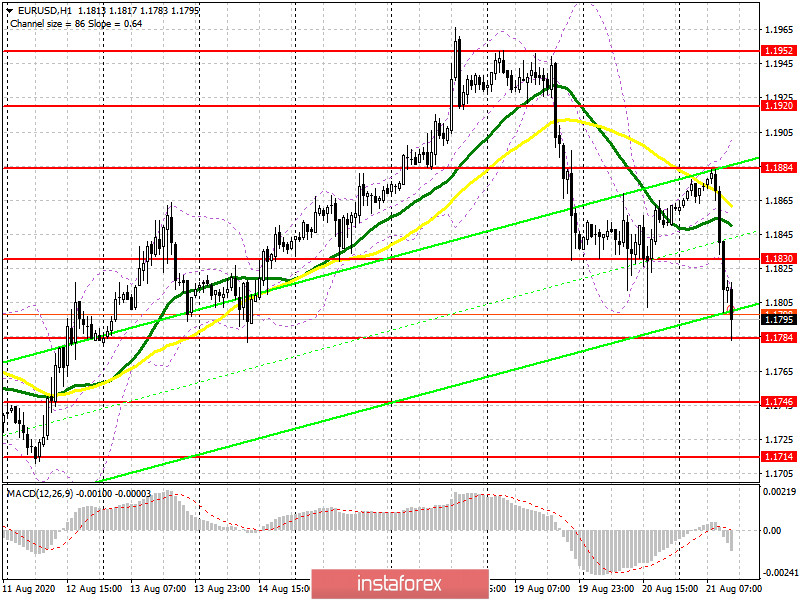
Trading is conducted below the 30 and 50 daily moving averages, which indicates the continuation of the downward correction of the market.
Note: The period and prices of moving averages are considered by the author on the hourly chart H1 and differ from the general definition of the classic daily moving averages on the daily chart D1.
Bollinger Bands
A break in the lower border of the indicator around 1.1784 will increase pressure on the euro. Growth will be limited by the upper level of the indicator in the area of 1.1884.
Description of indicators
- Moving average (moving average determines the current trend by smoothing out volatility and noise). Period 50. The graph is marked in yellow.
- Moving average (moving average determines the current trend by smoothing out volatility and noise). Period 30. The graph is marked in green.
- MACD indicator (Moving Average Convergence / Divergence - moving average convergence / divergence) Fast EMA period 12. Slow EMA period 26. SMA period 9
- Bollinger Bands (Bollinger Bands). Period 20
- Non-profit traders are speculators, such as individual traders, hedge funds, and large institutions that use the futures market for speculative purposes and meet certain requirements.
- Long non-commercial positions represent the total long open position of non-commercial traders.
- Short non-commercial positions represent the total short open position of non-commercial traders.
- Total non-commercial net position is the difference between short and long positions of non-commercial traders.


