


Trend analysis (Fig. 1).
The market may continue to move downward from the level of 1.1797 (closing of the Friday's daily candle) with the target at the support level of 1.1699 (black thick line). If this line is reached, the upward movement may continue with the next target at the upper fractal 1.1967 (red dotted line).
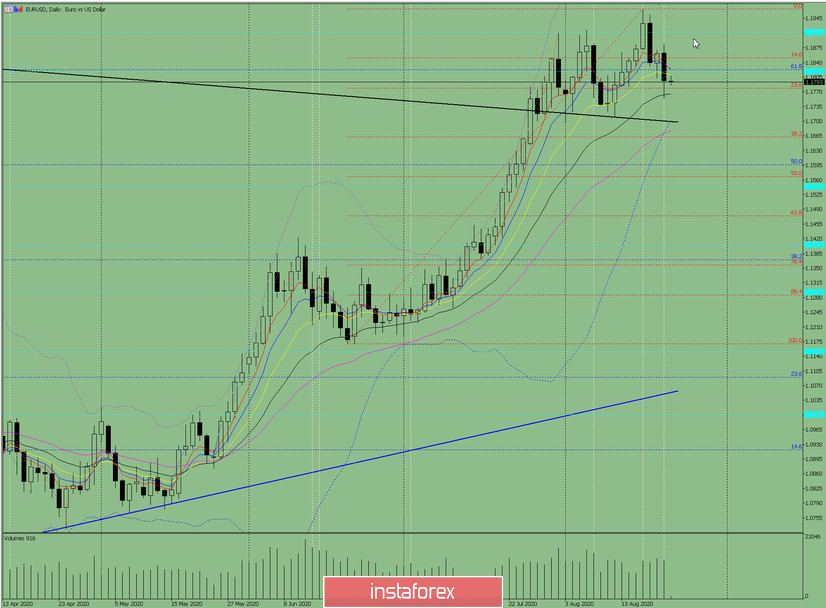
Figure: 1 (daily chart).
Comprehensive analysis:
- Indicator analysis - down;
- Fibonacci levels - down;
- Volumes - down;
- Candlestick analysis - up;
- Trend analysis - up;
- Bollinger lines - up;
- Weekly chart - down.
General conclusion:
Today the price may move downward with the target at the support levvel of 1.1699 (black bold line). If this line is reached, the upward movement may continue with the next target at the upper fractal 1.1967 (red dashed line).
Another posisble scenario is a downward trend towards the 21 average EMA - 1.1766 (black thin line). From here, the price may begin to move upward with the target at the nearest upper fractal 1.1884.


