


To open long positions on GBPUSD, you need:
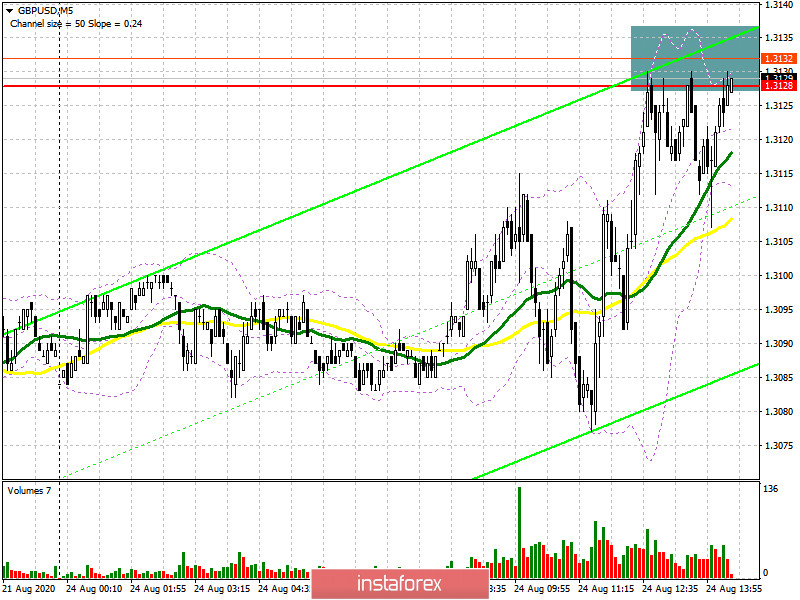
In the first half of the day, I recommended opening short positions after returning to the resistance of 1.3128. If you look at the 5-minute chart, you will see how the bears have already formed a false breakout at this level several times, and as long as the trade is conducted below this range, there is a real chance of a decline in the pound. The task of buyers for the second half of the day will be to break through and consolidate above this range, which will form a good entry point into long positions in the expectation of continuing the bullish correction to the maximum area of 1.3170, where I recommend fixing the profits. A further target will be the area of 1.3218. In the scenario of a decline in GBP/USD in the afternoon, it is best not to rush to open long positions, but to wait for the pair to return to the support area of 1.3063, from where you can buy the pound immediately on a rebound, counting on a correction of 20-30 points within the day.
To open short positions on GBPUSD, you need:
Bears have been actively defending the resistance of 1.3128 for half a day, but there was no major downward movement from this level. While trading will be conducted below this range, there is a real chance of a decline in the GBP/USD within the day to the support area of 1.3063, where I recommend fixing the profits. The longer-term goal will be at least 1.3007. In the scenario of a breakout of 1.3128 in the second half of the day, it is best to exit short positions and wait for the update of a larger maximum of 1.3170, where you can open short positions immediately for a rebound in the expectation of a correction of 20-30 points within the day.
Signals of indicators:
Moving averages
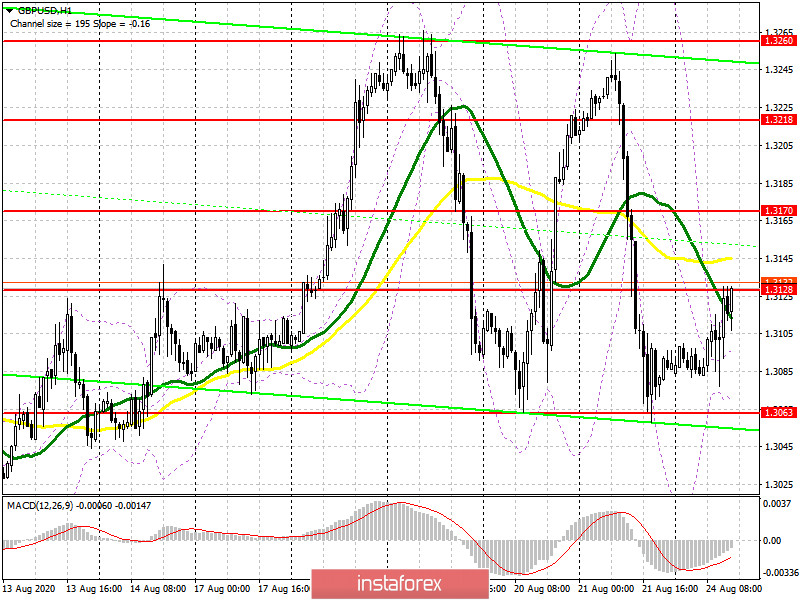
Trading is below the 30 and 50 daily averages, which indicates continued pressure on the pound.
Note: The period and prices of moving averages are considered by the author on the hourly chart H1 and differ from the general definition of the classic daily moving averages on the daily chart D1.
Bollinger Bands
If the pound falls, the lower border of the indicator in the area of 1.3075 will provide support.
Description of indicators
- Moving average (moving average determines the current trend by smoothing out volatility and noise). Period 50. The graph is marked in yellow.
- Moving average (moving average determines the current trend by smoothing out volatility and noise). Period 30. The graph is marked in green.
- MACD indicator (Moving Average Convergence / Divergence - moving average convergence / divergence) Fast EMA period 12. Slow EMA period 26. SMA period 9
- Bollinger Bands (Bollinger Bands). Period 20
- Non-profit traders are speculators, such as individual traders, hedge funds, and large institutions that use the futures market for speculative purposes and meet certain requirements.
- Long non-commercial positions represent the total long open position of non-commercial traders.
- Short non-commercial positions represent the total short open position of non-commercial traders.
- Total non-commercial net position is the difference between short and long positions of non-commercial traders.


