


Recently, the pound has been under moderate selling pressure, which is due to several factors. In the second quarter of this year, the British economy lost about 20 percent, which was caused by the COVID-19 pandemic. However, even before the coronavirus period, the UK economy did not shine with good indicators, and even then it was clear that the probability of an economic downturn is very high.
Another factor of pressure on the British currency is the impasse regarding the UK's exit from the European Union. London and Brussels are unable to agree on the terms of the Brexit deal, and the negotiations themselves are constantly postponed. It is quite possible that by the end of the year, the parties will not agree on any deal and the so-called "hard Brexit" will follow, which was initially supported by the current British Prime Minister Boris Johnson.
And another factor that puts pressure on the "Briton" is the possibility of the Bank of England moving to negative interest rates. However, the latest inflation data, which is considered the consumer price index, came out quite positive compared to the forecasts of economists. I believe that the British Central Bank will refrain from applying negative rates, however, it may well expand the asset purchase program by another 70 billion pounds.
Daily
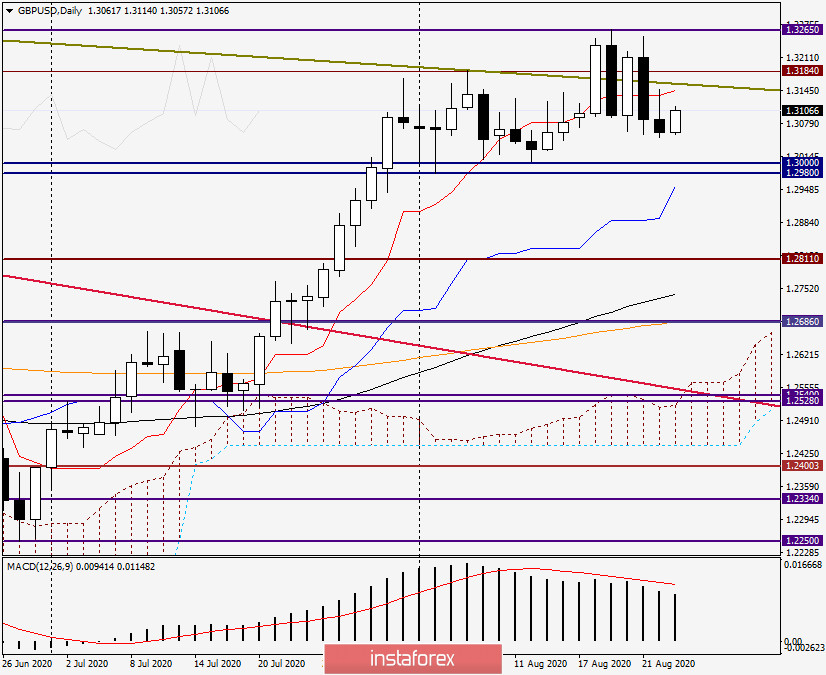
As can be seen on the daily chart, after the initial growth, the GBP/USD currency pair met strong resistance when trying to break through the Tenkan line of the Ichimoku indicator. After that, the quote turned to decline, and Monday's trading closed at 1.3062. Today, at the moment of writing, the bulls for the pound resumed the rise of the exchange rate and, quite possibly, will once again test the Tenkan line for a breakdown, which today passes at 1.3146. If this task is within their capabilities and the trading ends above 1.3146, the next targets at the top will be 1.3184, 1.3200, 1.3253, and 1.3265. At the same time, only a breakdown of the last level will give hope for the subsequent strengthening of the pair. In general, the situation on the daily chart of GBP/USD is very similar to that on the same timeframe for the euro/dollar.
H4
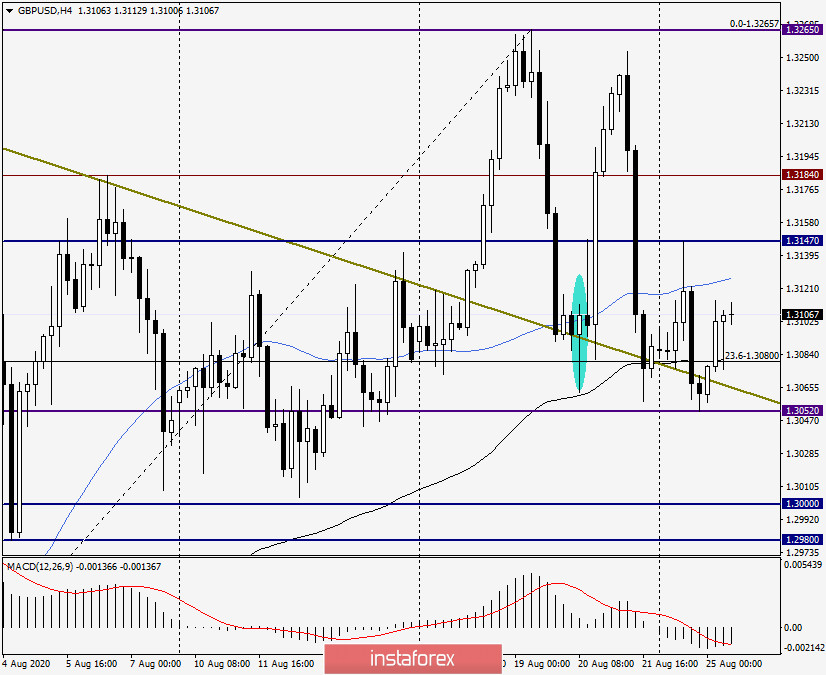
And on this chart, the stumbling block for players to increase the rate was the 50 simple moving average, which more than confidently reflected the attempt to breakthrough. After the decline to the strong technical level of 1.3050, the pair received support and it began an active recovery from 1.3052. 50 MA will likely be tested again for a breakdown. If successful, the bulls will have to break through the sellers' resistance, which is at 1.3147, and only after fixing above this already broken level, you can try to buy on the rollback to it. If bearish patterns of Japanese candles appear under 50 MA or resistance level of 1.3147, this will be a signal to open short positions on GBP/USD.
H1
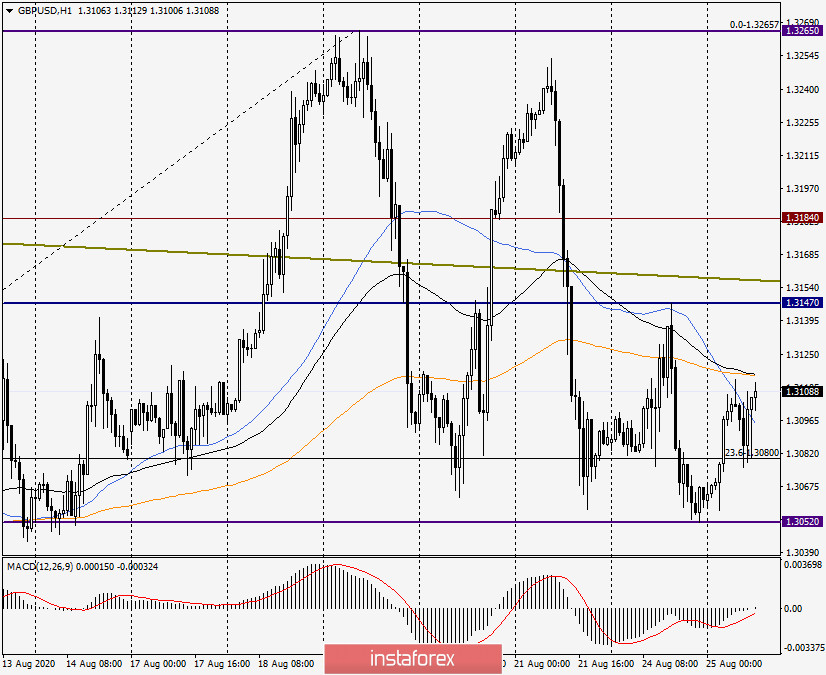
At the end of this review, the hourly chart shows attempts to break through the used moving averages: 50 MA, 200 EMA, and 89 EMA. Also, the pair is trying to gain a foothold above the strong technical level of 1.3100. If both attempts bring a positive result, on a pullback to the price zone of 1.3118-1.3100, I recommend looking for an opportunity to buy a pair with goals at 1.3158, 1.3180 and 1.3200. It is too early to talk about further landmarks at the top.


