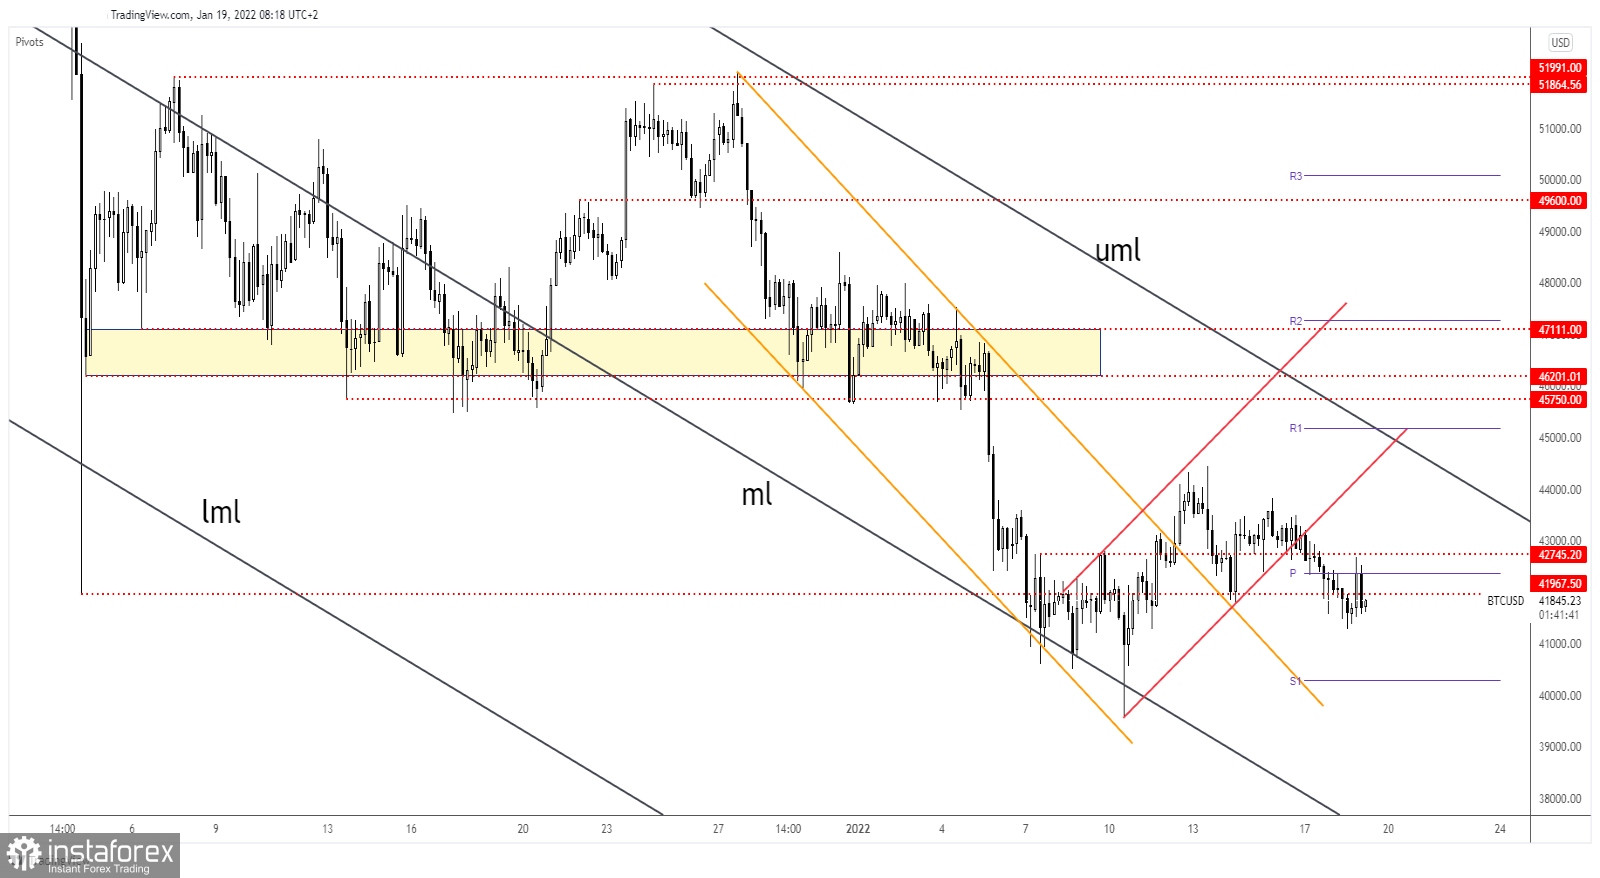
The price of Bitcoin is trading at 41,816.41 at the time of writing. The bias remains bearish after failing to stabilize above the near-term downside obstacles. In the short term, BTC/USD moves somehow sideways, it could develop a range pattern or a triangle.
The outlook remains bearish at the time of writing. Personally, I believe that only a major bullish pattern could change the sentiment. It has changed little in the short term. In the last 24 hours, BTC/USD is down by 1.17% and by 2.35% in the last 7 days.
BTC/USD More Declines In Cards!

BTC/USD retested the weekly pivot point (42,371.61) and now is trading back below the 41,967.50. As long as it stays under these levels, the price of bitcoin could slip lower. In the short term, it seems undecided, BTC/USD could continue to move sideways.
Technically, the 40,000 psychological level stands as a static support. Also, the 40,295.92 weekly S1 represents an important downside obstacle. BTC/USD tries to accumulate more bullish energy before developing a new leg higher. A new lower low, dropping and closing below 41,290.06 yesterday's low could activate more declines.
BTC/USD Prediction!
Bitcoin is bearish and it could drop deeper after failing to close above the weekly pivot point in the last attempt. A new lower low could bring new selling opportunities in the short term, the 40,000 psychological level could be used as a downside obstacle.


