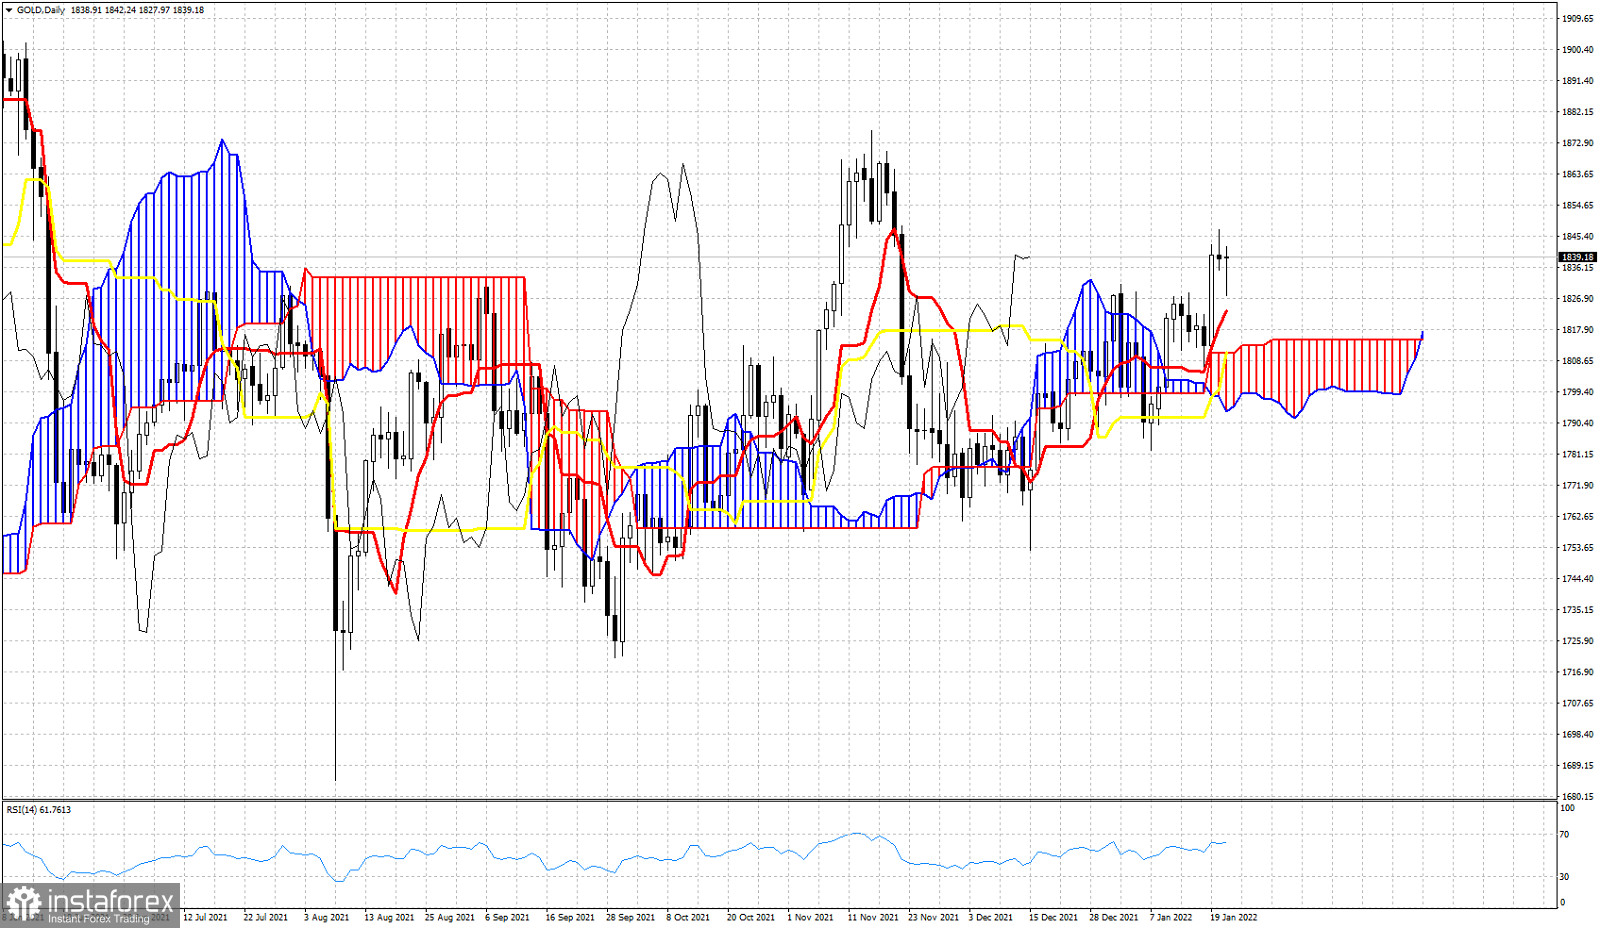
Gold price remains in a short-term bullish trend. In previous posts we talked about the break out above the horizontal resistance of $1,830 and the potential for a move towards $1,860. Today we use the Ichimoku cloud indicator analysis to point key support levels as Gold is trading higher.

In Ichimoku cloud terms Gold price is in a bullish trend. Price in the Daily chart is above the Kumo (cloud) and above both the tenkan-sen (red line indicator) and the kijun-sen (yellow line indicator). Also the Chikou span (black line indicator) is above the candlestick pattern. Both the tenkan-sen and kijun-sen are positively sloped. Support by the tenkan-sen is at $1,823 and by the kijun-sen at $1,811. At $1,811 we also find the upper cloud boundary. Bulls do not want to see price break below $1,811. Until then, they remain in control of the short-term trend.


