To open long positions on EUR/USD, you need to:
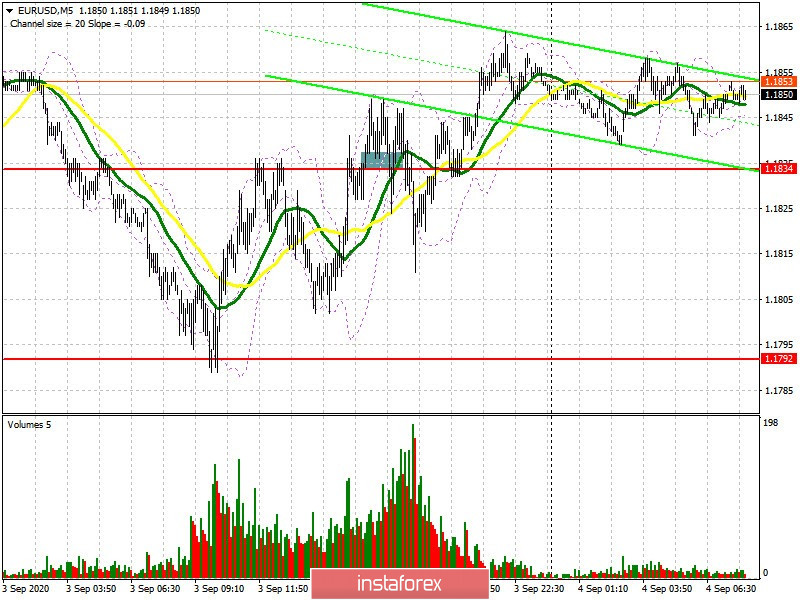
The only signal to buy the European currency was formed yesterday afternoon, which I mentioned in my review. If you look at the 5 minute chart, you will see that after forming a breakout and settling above the 1.1834 level, there was an attempt to form a good entry point into long positions while expecting the euro to recover. Testing the 1.1834 level from top to bottom became the entry point. The upward movement from this level was around 30 points, after which active players left the market ahead of today's release of the important Nonfarm Payrolls report for the United States. A lot will depend on this indicator and a high surge in volatility cannot be avoided. Most likely, movement will not stay in one direction, since this indicator does not reflect the whole picture of what is happening in the US labor market due to the assistance programs. The market can go one way and then the other, pick up stops and close by slightly deviating from the day's opening level.
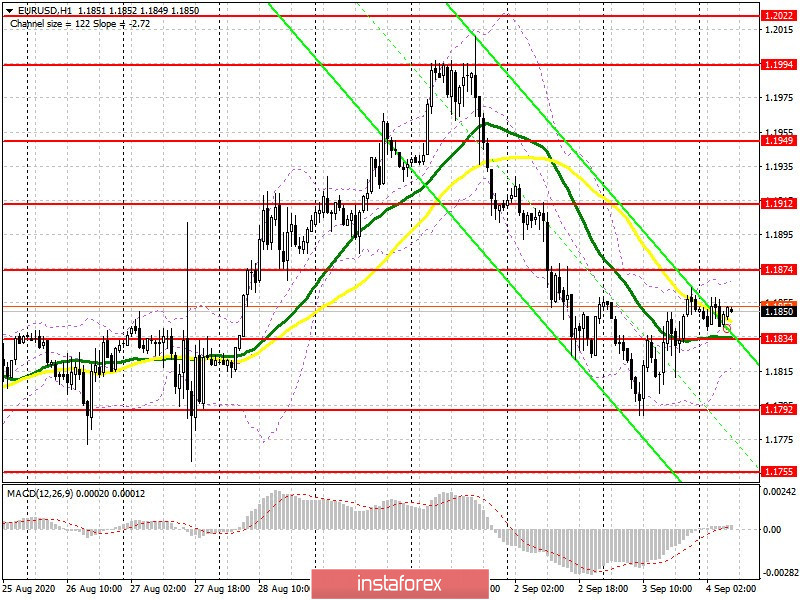
As for the current situation, buyers of the euro need to protect the support of 1.1834, forming a false breakout there will be a signal to open long positions in anticipation of continuing the upward correction after the euro's weekly fall. Consolidating above the 1.1874 level also forms an additional point to buy EUR/USD in order to update the high of 1.1912, which is where I recommend taking profits. The long-term target will be 1.1949. If buyers are not active in the 1.1834 area in the morning, it is best to postpone long positions until the weekly low of 1.1792 has been updated, or buy EUR/USD immediately for a rebound from the support of 1.1755 based on a correction of 20-30 points within the day. Let me remind you that the Commitment of Traders (COT) reports for August 25 showed an increase in long non-commercial positions from 259,244 to 262,061, while short non-commercial positions decreased from 62,301 to 50,309. Since closing long positions stopped and after a short pause, traders began to actively buy euros again on the futures market, we can expect the upward trend to continue in the first half of September.

To open short positions on EUR/USD, you need:
Sellers need to recuperate and regain the 1.1834 level, since the pair's direction depends on it. Staying below this range, together with a good report on the state of the US labor market, forms a strong sell signal for EUR/USD while aiming to fall towards this week's low at 1.1792 along with its breakout. Such a scenario will indicate that the bearish trend has returned for the euro and will also open a direct path to the support at 1.1755, which is where I recommend taking profits. An important task for the bears is to protect the resistance at 1.1874. A false breakout in that area will be a signal to open short positions in the euro, since the pair may continue to strengthen before the release of the Nonfarm Payrolls report. I recommend selling on a rebound only when the high of 1.1912 has been updated, based on a correction of 20-30 points within the day.

Indicator signals:
Moving averages
Trading is carried out in the area of 30 and 50 moving averages, which indicates uncertainty before the release of important fundamental data.
Note: The period and prices of moving averages are considered by the author on the H1 hourly chart and differs from the general definition of the classic daily moving averages on the daily D1 chart.
Bollinger Bands
A breakout of the lower border of the indicator around 1.1825 will increase pressure on the euro. A breakout of the upper border of the indicator in the 1.1865 area will lead to a new wave of euro growth.
Description of indicators
- Moving average (moving average, determines the current trend by smoothing out volatility and noise). Period 50. It is marked in yellow on the chart.
- Moving average (moving average, determines the current trend by smoothing out volatility and noise). Period 30. It is marked in green on the chart.
- MACD indicator (Moving Average Convergence/Divergence — convergence/divergence of moving averages). Fast EMA period 12. Slow EMA period to 26. The 9 period SMA.
- Bollinger Bands (Bollinger Bands). The period 20.
- Non-commercial speculative traders, such as individual traders, hedge funds, and large institutions that use the futures market for speculative purposes and meet certain requirements.
- Long non-commercial positions represent the total long open position of non-commercial traders.
- Short non-commercial positions represent the total short open position of non-commercial traders.
- Total non-commercial net position is the difference between the short and long positions of non-commercial traders.


