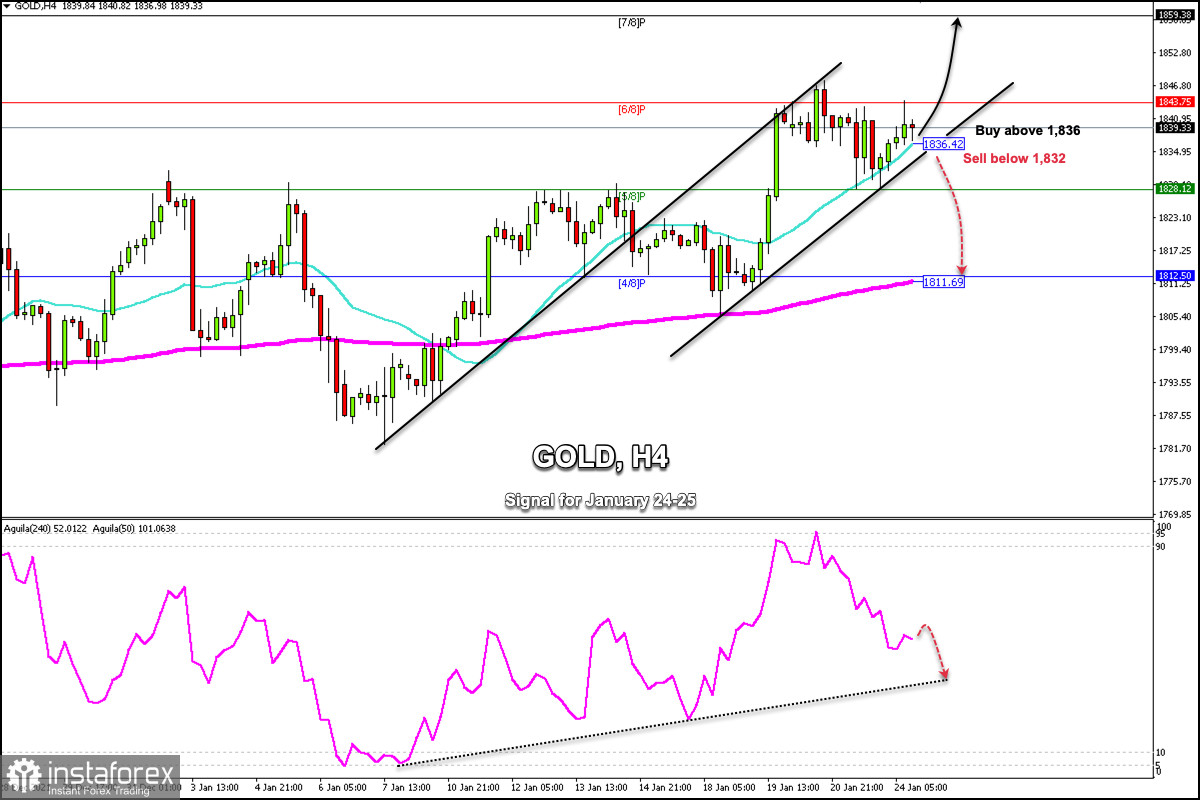
Gold has been trading at 1,839 above the 21 SMA and inside the uptrend channel formed since Jan 14. Early in the European session, gold hit a high of 1,844. Currently, the price is reversing and a technical bounce around the 21 SMA is likely.
The 21 SMA and trend channel are giving gold a bullish bias. A consolidation on the 4-hour chart above 6/8 Murray could accelerate the bullish move towards 7/8 Murray around 1,859.
On the contrary, if the price breaks sharply the uptrend channel and a closes below 1,830 on the 4-hour chart, a technical correction could occur with targets towards 1,828 and up to 200 EMA located at 1,811.
The eagle indicator is signaling a bearish move. We can wait for confirmation, only if gold trades below 1,832. We can also see that the indicator is resting on the top of an uptrend channel since January 7. It means that the trade volume could decrease and gold could make a bearish move in the next few hours.
Support and Resistance Levels for January 24 - 25, 2022
Resistance (3) 1,859
Resistance (2) 1,852
Resistance (1) 1,843
----------------------------
Support (1) 1,829
Support (2) 1,820
Support (3) 1,812
***********************************************************
Scenario
Timeframe H4
Recommendation: buy if it rebound around
Entry Point 1,836
Take Profit 1,843 (6/8) 1,859 (7/8)
Stop Loss 1,831
Murray Levels 1,859 (7/8) 1,843 (6/8) 1,828(5/8) 1,812 (4/8)
***************************************************************************


