Daily

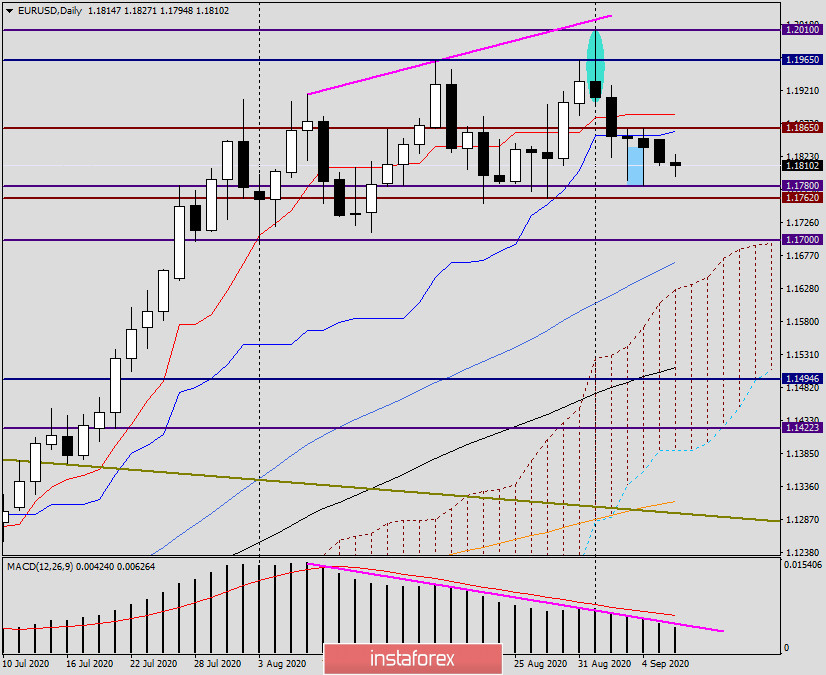
There were no significant changes in the technical picture of the main currency pair even though the EUR/USD pair declined at the end of yesterday's trading. On the daily chart, the euro/dollar is trading in the range of 1.1865-1.1780, the exit from which may determine the further direction of the exchange rate. If we consider the tasks of the warring parties, they are more difficult for euro bulls. In addition to the resistance level of 1.1865, they will need to pass up two strong lines of the Ichimoku indicator: Kijun (blue) and Tenkan (red). If the latter breaks, the pair will again rush to storm the 19th figure, after which it will need to break through the resistance levels of 1.1965 and 1.010, where the maximum values were shown on August 21 and September 1, respectively.
In general, the September trading for the single European currency is still taking place in negative shades, however, there is still a decision of the European Central Bank (ECB) on rates and a press conference of the head of this department, Christine Lagarde. There is little doubt that the ECB will keep its key interest rate at zero. In this situation, most market participants will be interested in what Christine Lagarde has to say. It seems that the main topics of the head of the ECB will be inflation, COVID-19, as well as possible concerns of the regulator about the high exchange rate of the single European currency. The ECB's decision on rates and Christine Lagarde's press conference will take place on Thursday, September 10.
If you go back to the technical picture, you need to calculate the bearish scenario. So, the first task of players to lower the rate will be to break the support level of 1.1780, where the minimum trading values were shown on September 4. If the bears manage to push through this level, their subsequent targets will be 1.1750 and 1.1700. As I mentioned earlier, in my opinion, only a true breakdown of 1.1700 will indicate that the upward trend for the EUR/USD pair has changed to a downward trend.
H4

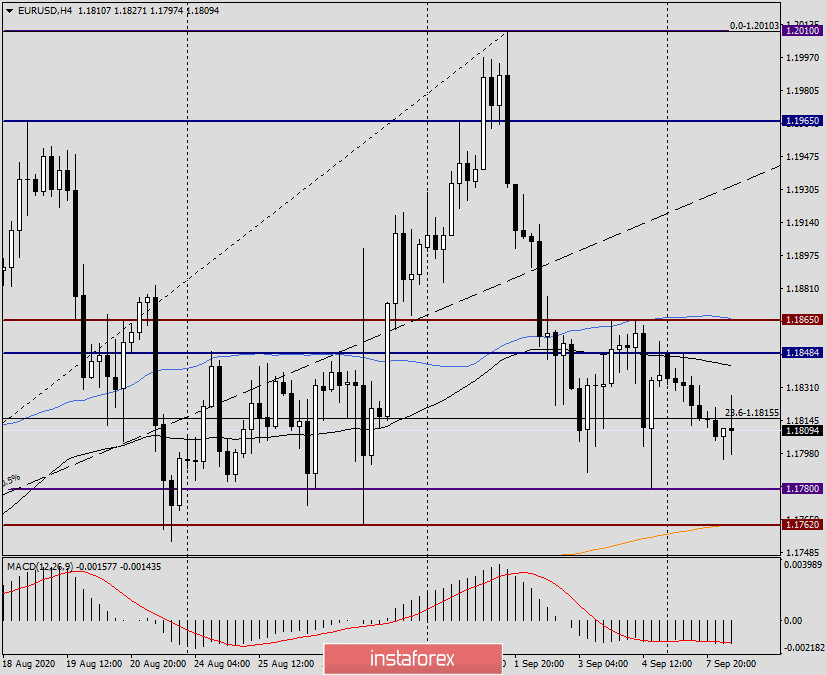
If you look at the 4-hour timeframe, you can see how much resistance to growth attempts is provided by the 89 exponential (black) and 50 simple (blue) moving averages. At the same time, it should be taken into account that 50 MA is exactly at the resistance level of 1.1865, which will undoubtedly only strengthen this mark and make it more difficult to pass.
However, the bears will not end their tests after the breakout of 1.1780. Note the level of 1.1762, where the lows of August 27 were shown, where the 200 exponential moving average is also located.
H1

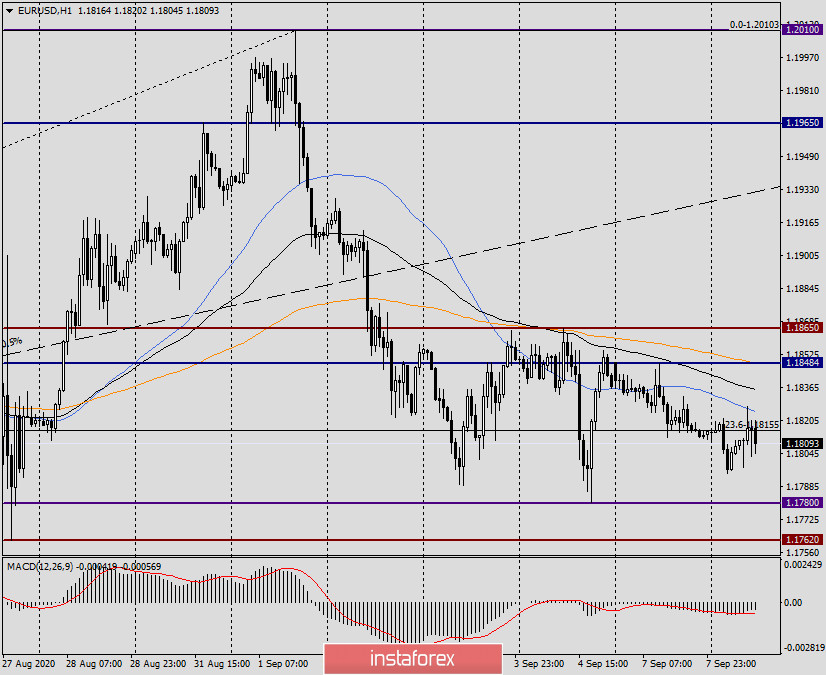
Finally, let's look at the hourly chart of EUR/USD. As you can see, during today's Asian session, the pair declined to 1.1796, where it found support and turned to strengthen. It is difficult to judge how long it will be because the euro/dollar is traded under all the moving averages used, which will need to be overcome.
Conclusion and trading recommendations for EUR/USD:
Although the situation is not clear, judging by the technical picture on the charts, the reversal becomes more obvious. I believe that the main influence on the prospects for the price dynamics of the euro will have the ECB.
At the moment, I am more inclined to sell the pair after rising to 1.1825, 1.1835, 1.1850, and 1.1865. If bullish patterns of Japanese candlesticks appear near the support levels of 1.1780 and 1.1762, this will be a signal for opening short positions on the EUR/USD pair.


