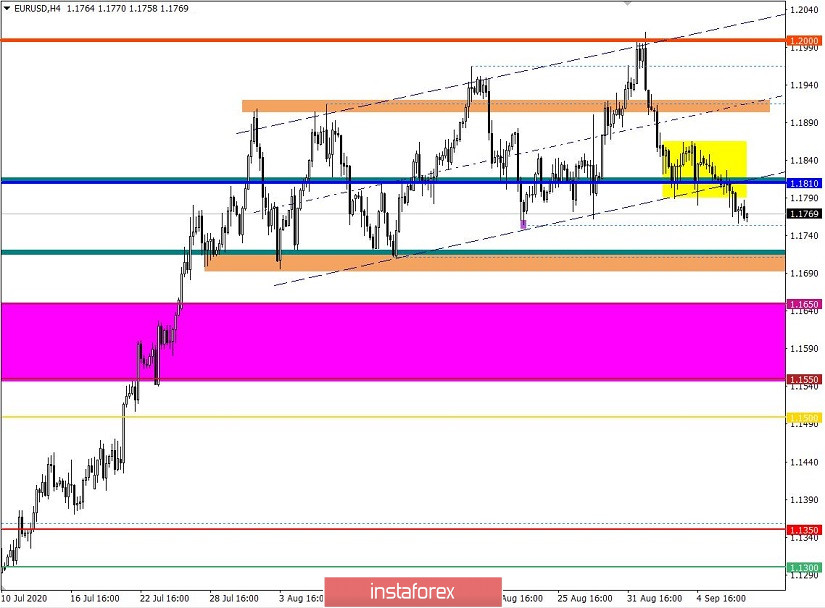
EUR / USD has finally consolidated below 1.1780, and this suggests that the market could be on the verge of a trend change. Traders are now focusing on price level 1.1700, as a breakout from which will return the quote back to its previous range at 1.1000 / 1.1.180.
So, if we look into detail the movement of EUR / USD yesterday, that is, trades on M15 time frame, short positions arose from the European session up to the end of the US session.
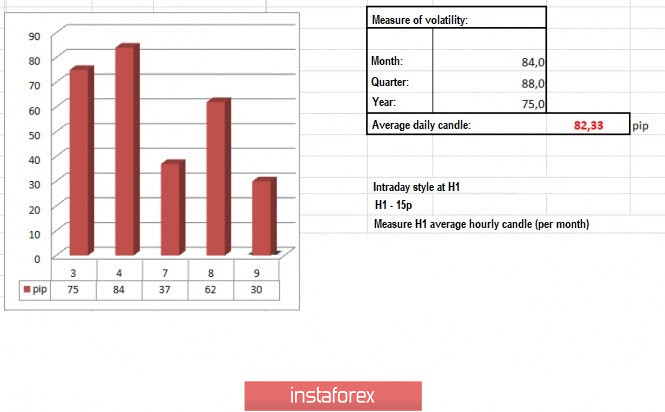
It gave high dynamics in terms of volatility, recording an acceleration of about 67%. But if we look at it relative to the average level, a slowdown is visible, having only 62 points from 82 points.
This is because as discussed in the previous review, traders were waiting for a consolidation below 1.1780, as such will push the quote towards the range 1.1755-1.1700.
In addition, a correction to 1.2000 was observed in the daily chart, and it has surpassed all fluctuations from the previous month.

Meanwhile, with regards to statistics, the third estimate for EU Q2 GDP was slightly better than expected. Instead of a decline from -3.2% to -15.0%, there was a slowdown to -14.7%.
Data for open vacancies in the US labor market, that is, JOLTS for the month of July, is scheduled to be published today, and its forecast is a positive rise from 5,889 to 6,000, which, if turns out true, will benefit the US dollar.
Further development
As we can see on the trading chart, the market is on a serious bearish sentiment, because of which the quote traded within the local low at 1.1754. If the price consolidates below this value, EUR / USD will drop to 1.1700, but if the quote consolidates above, price will rise to 1.1760 / 1.1800.

Indicator analysis
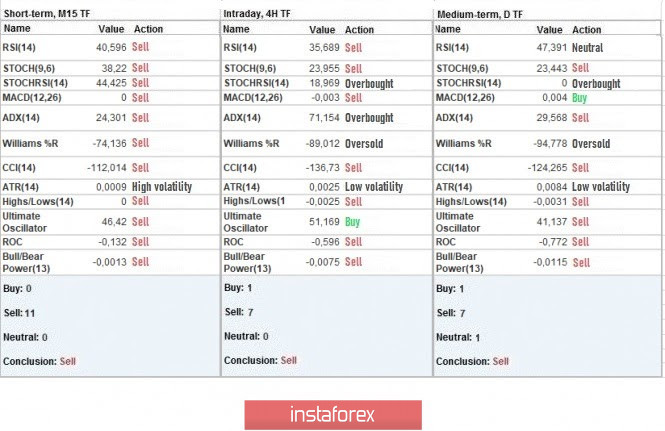
Looking at the different time frames (TF), we can see that all periods signal sell, mainly due to the prevailing bearish sentiment in the market.

Weekly volatility / Volatility measurement: Month; Quarter; Year
Volatility is measured relative to the average daily fluctuations, which are calculated every Month / Quarter / Year.
(The dynamics for today is calculated, all while taking into account the time this article is published)
Volatility is at 30 points, which is 63% below the average value. However, the dynamics could still accelerate, one reason for which is the upcoming ECB meeting on Thursday, which could significantly affect trading in the market.

Key levels
Resistance zones: 1,1800; 1.1910 **; 1.2000 ***; 1.2100 *; 1.2450 **; 1.2550; 1.2825.
Support Zones: 1.1650 *; 1,1500; 1.1350; 1.1250 *; 1.1180 **; 1.1080; 1.1000 ***.
* Periodic level
** Range level
*** Psychological level
Also check trading recommendations for the GBP/USD pair here, or brief trading recommendations for the EUR/USD and GBP/USD pairs here.


