To open long positions on GBPUSD, you need to:
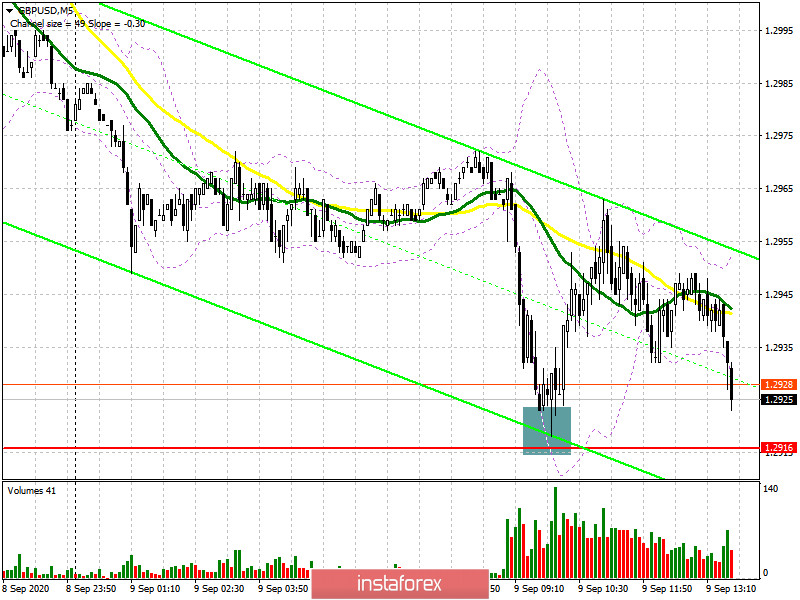
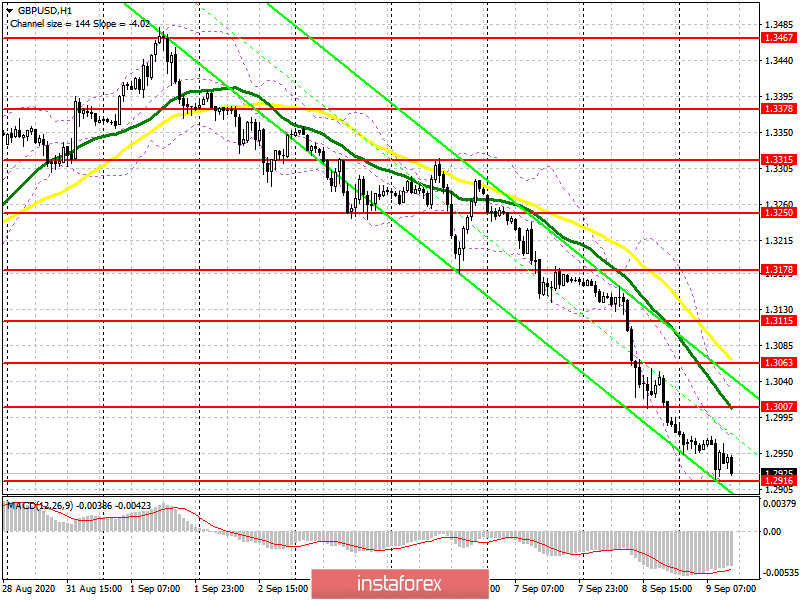
I paid attention to purchases from the support level of 1.2916 in my morning forecast, counting on correction of 30-40 points, which turned out to be the case. On the 5-minute chart, the sharp fall of the pound to the level of 1.2916 resulted in profit-taking by speculators, which led to a slight rebound in GBP/USD. However, the bears did not give up their task, and now they are gradually returning the pair to this support range. Therefore, the technical picture has not changed. Bulls still need the protection of 1.2916, but now you can open long positions from this level after forming a false breakout in the expectation of a return and recovery of the pound to the resistance of 1.3007, where I recommend fixing the profits. Moving averages are also located at this level, which is another problem for buyers. A break and consolidation above 1.3007 will indicate a real possibility of forming an upward correction of the bear market, which we have been observing since August 31. If there is no bull activity at the level of 1.2916, I recommend that you postpone long positions until the larger lows of 1.2840 and 1.2725 are updated, based on a correction of 30-40 points within the day.

To open short positions on GBPUSD, you need:
Bears have already tested the strength of the support of 1.2916 and a repeated return to this level on the wave of pessimism that now reigns among buyers due to the Brexit situation will most likely lead to a consolidation of GBP/USD below this range. In this case, you can re-open short positions in the continuation of the bear market in the expectation of updating the minimum of 1.2840, where I recommend fixing the profit. The area of 1.2725 remains a longer-range target, however, it will not be easy to reach it. We need another negative news event in the form of the same tough response from the EU to the UK on the trade agreement. In the scenario of recovery of the pair in the afternoon, I recommend that you postpone short positions until the maximum of 1.3007 is updated and sell GBP/USD from there immediately for a rebound in the expectation of a correction of 30-40 points within the day.

Signals of indicators:
Moving averages
Trading is conducted below the 30 and 50 daily averages, which indicates that the downward correction for the pair remains.
Note: The period and prices of moving averages are considered by the author on the hourly chart H1 and differ from the general definition of classic daily moving averages on the daily chart D1.
Bollinger Bands
In case of growth, the upper limit of the indicator will act as a resistance in the area of 1.3010, from which you can sell the pound immediately for a rebound.
Description of indicators
- Moving average (moving average determines the current trend by smoothing out volatility and noise). Period 50. The graph is marked in yellow.
- Moving average (moving average determines the current trend by smoothing out volatility and noise). Period 30. The graph is marked in green.
- MACD indicator (Moving Average Convergence / Divergence - moving average convergence / divergence) Fast EMA period 12. Slow EMA period 26. SMA period 9
- Bollinger Bands (Bollinger Bands). Period 20
- Non-profit speculative traders, such as individual traders, hedge funds, and large institutions that use the futures market for speculative purposes and meet certain requirements.
- Long non-commercial positions represent the total long open position of non-commercial traders.
- Short non-commercial positions represent the total short open position of non-commercial traders.
- Total non-commercial net position is the difference between the short and long positions of non-commercial traders.


