To open long positions on GBPUSD, you need:
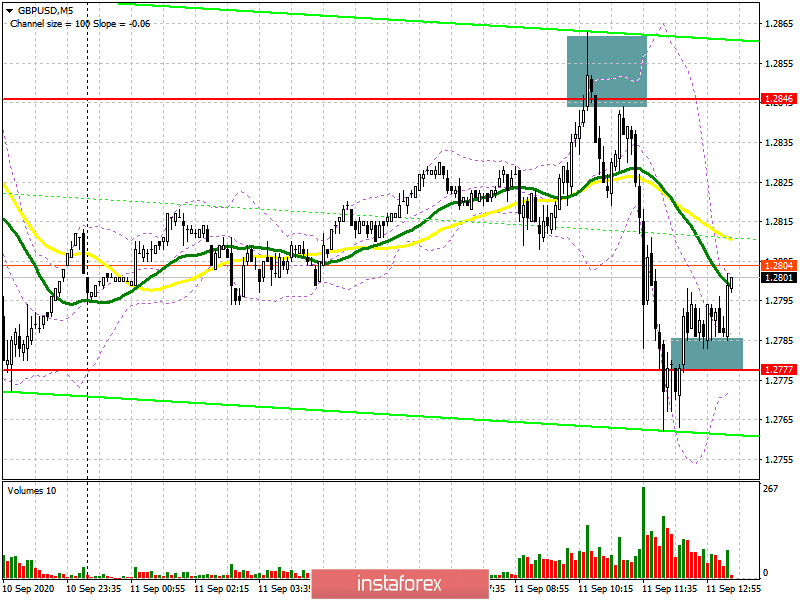
In my morning forecast, I recommended opening short positions after the formation of a false breakout at the level of 1.2846, which is what happened. On the 5-minute chart, the bears quickly returned the pair to the level of 1.2846 after an unsuccessful attempt to grow, testing it from the bottom up, which formed a good entry point for short positions. This led to a rapid decline of the pair to the area of the week's low of 1.2777 and brought about 70 points of profit. I also paid attention to purchases, provided that a false breakout is formed in the area of 1.2777. You can see the entry point for long positions on the chart. As long as trading is conducted above the area of 1.2777, you can count on a repeated return of GBP/USD to the resistance area of 1.2846, as well as a more successful attempt to break through this range. However, only after fixing above 1.2846, you can increase long positions and expect to update the highs of 1.2890 and 1.2940, where the moving averages also pass, playing on the side of the pound sellers. However, we can expect such a large movement only after very bad data on inflation in the US. If there is a breakdown of the support of 1.2777 in the afternoon, I recommend postponing purchases of the pound until the new lows of 1.2725 and 1.2675 are updated, based on a correction of 30-40 points by the end of the day.

To open short positions on GBPUSD, you need:
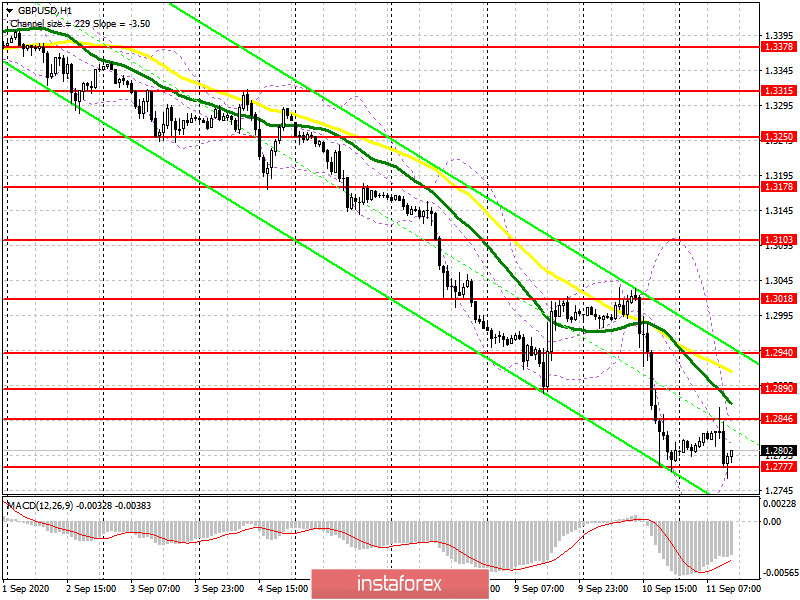
Bears continue to keep the market under their control, although it is worth noting the active opposition of bulls at the level of 1.2777, which may force sellers to fix short positions at the end of the week after such a large drop in the pair. However, in the case of good fundamental statistics on the US economy, bears can quickly return GBP/USD to the support area of 1.2777, and consolidation below forms an additional entry point into short positions in the expectation of updating the next lows in the area of 1.2725 and 1.2675, where I recommend fixing the profits. If the pair rises above 1.2846, you can return to short positions only after updating the level of 1.2890 or for a rebound from the larger resistance of 1.2890 in the expectation of a correction of 30-40 points at the end of the day.

Signals of indicators:
Moving averages
Trading is conducted below the 30 and 50 daily averages, which indicates a further decline in the pound on the trend.
Note: The period and prices of moving averages are considered by the author on the hourly chart H1 and differ from the general definition of the classic daily moving averages on the daily chart D1.
Bollinger Bands
A break of the lower limit of the indicator in the area of 1.2777 should lead to a larger sell-off of the pound.
Description of indicators
- Moving average (moving average determines the current trend by smoothing out volatility and noise). Period 50. The graph is marked in yellow.
- Moving average (moving average determines the current trend by smoothing out volatility and noise). Period 30. The graph is marked in green.
- MACD indicator (Moving Average Convergence / Divergence - moving average convergence / divergence) Fast EMA period 12. Slow EMA period 26. SMA period 9
- Bollinger Bands (Bollinger Bands). Period 20
- Non-profit speculative traders, such as individual traders, hedge funds, and large institutions that use the futures market for speculative purposes and meet certain requirements.
- Long non-commercial positions represent the total long open position of non-commercial traders.
- Short non-commercial positions represent the total short open position of non-commercial traders.
- Total non-commercial net position is the difference between the short and long positions of non-commercial traders.


