To open long positions on GBP/USD, you need:
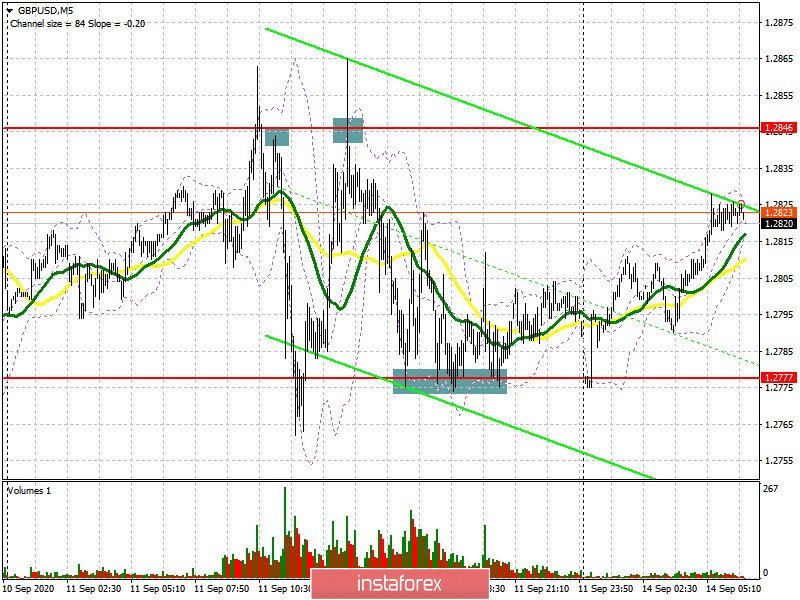
Several profitable signals appeared on Friday, both to buy and sell the pound. I paid attention to their probability in my reviews. Let's take a look at the deals and see where you could make money. A signal to sell the pound appeared in the morning after an unsuccessful attempt to go above the resistance of 1.2846, which caused the pair to sharply fall to the low of 1.2777. Returning to the 1.2846 area in the afternoon, and actively selling the pound to the 1.2777 area, where an entry point to long positions appeared, as the bears failed to break through the area below this range.
Very important changes have taken place in the futures market. The Commitment of Traders (COT) reports for September 8 showed a decrease in long positions, but short positions also sharply fell, which indicates profit taking after a fairly large bear market that we saw recently. This is also evidence that further downward momentum may start a gradual slowdown, but much will depend on the terms of the Brexit deal. Short non-commercial positions decreased from 42,901 to 33,860 during the reporting week. Long non-commercial positions fell just slightly, from 49,213 to 46,590. As a result, the non-commercial net position increased to 12,730 against 6,312 weeks earlier.

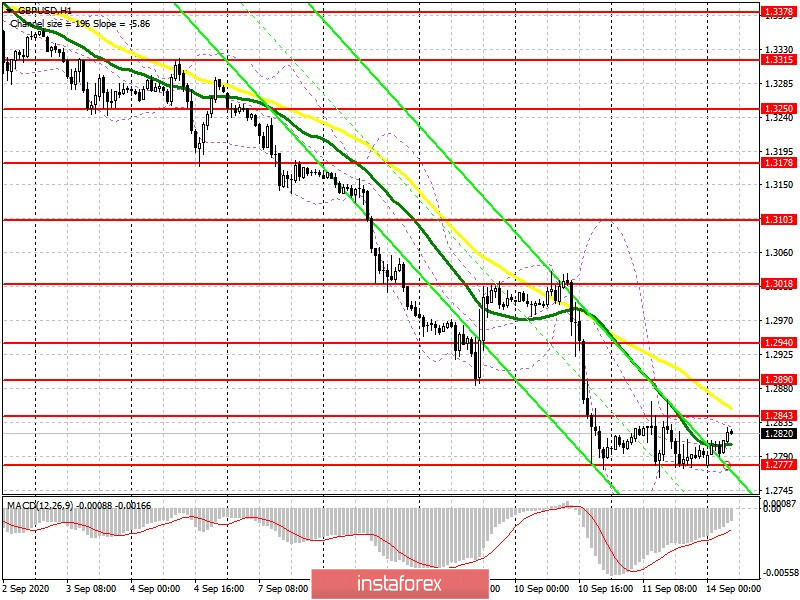
I do not recommend rushing to open long positions on the GBP/USD pair at the moment. Forming a false breakout in the support area of 1.2777 can lead to an attempt by the bulls to build an upward correction. A more adequate solution would be to open long positions after updating the monthly low of 1.2725, subject to the same false breakout, or buying on a rebound from the 1.2675 support, counting on a correction of 30-40 points within the day. An equally important task for the bulls is to return and settle at the 1.2843 level, where the moving average passes, which plays on the side of the bears. This could cause the pair to grow to the resistance area of 1.2890, where I recommend taking profits. A high of 1.3018 will be the long term goal, but we will only be able to reach it in case of good news on Brexit.
To open short positions on GBP/USD, you need:
The actions of sellers will be similar to last Friday. The bears will be more active after the pair falls and settles below support at 1.2777. This forms a signal to sell the pound. In this scenario, one can expect a larger downward movement already in the area of new monthly lows of 1.2725 and 1.2675, where I recommend taking profits. For those who are cautious about selling at lows, it is best to wait for an upward correction that could form in the morning. In this case, a false breakout in the resistance area of 1.2843 will lead to the first sell signal. However, if the market isn't active at this level and the pair rapidly falls, it is best to postpone short positions, as larger players will wait until the 1.2890 high is updated, from which you can sell GBP/USD right on the rebound.

Indicator signals:
Moving averages
Trading is carried out below 30 and 50 moving averages, which indicates a continuation of the bear market.
Note: The period and prices of moving averages are considered by the author on the H1 hourly chart and differs from the general definition of the classic daily moving averages on the daily D1 chart.
Bollinger Bands
A breakout of the lower border of the indicator in the 1.2777 area will lead to a new wave of decline in the British pound. A breakout of the upper border in the 1.2840 area will lead to an upward correction of the pair.
Description of indicators
- Moving average (moving average, determines the current trend by smoothing out volatility and noise). Period 50. It is marked in yellow on the chart.
- Moving average (moving average, determines the current trend by smoothing out volatility and noise). Period 30. It is marked in green on the chart.
- MACD indicator (Moving Average Convergence/Divergence — convergence/divergence of moving averages) Quick EMA period 12. Slow EMA period to 26. SMA period 9
- Bollinger Bands (Bollinger Bands). Period 20
- Non-commercial speculative traders, such as individual traders, hedge funds, and large institutions that use the futures market for speculative purposes and meet certain requirements.
- Long non-commercial positions represent the total long open position of non-commercial traders.
- Short non-commercial positions represent the total short open position of non-commercial traders.
- Total non-commercial net position is the difference between short and long positions of non-commercial traders.


