Today's review of the main currency pair of the Forex market, as usual on Mondays, will start with the results of the past week. We must admit that the US dollar is gradually recovering from the rather strong pressure that the "American" was under only recently. At the trading on September 7-11, the dollar was trading in different directions in pairs with its main competitors.
Weekly
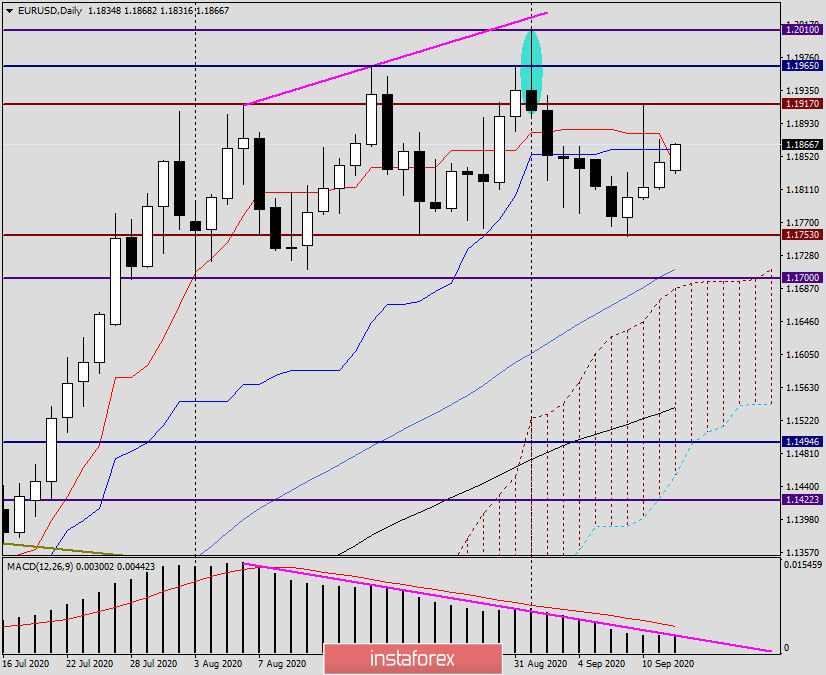
The expectations of those who thought that the President of the European Central Bank (ECB), Christine Lagarde, would bring down the euro at her press conference were not met. Apparently, ECB officials are quite satisfied with the current exchange rate of the single European currency, since we did not hear any statements by Lagarde about the euro being too expensive. Against this background, the EUR/USD pair showed mixed dynamics and ended the last five-day trading in the same place where it started. As a result, a doji candle appeared on the weekly chart with rather long shadows, of which the lower one was slightly longer. Usually, a long lower shadow of the candle indicates that the market is unwilling to move in a southerly direction. In this case, the decline was limited by the strong technical level of 1.1750, which is not the first time it performs the function of strong support. As has been repeatedly noted in previous articles on the euro/dollar, only an alternate breakdown of 1.1750 and 1.1700 with consolidation below the last level will indicate a change in the upward trend for the euro/dollar. At the moment, the pair is trading in the range of 1.1750-1.2000. With a high degree of probability, we can assume that this is nothing more than consolidation before the subsequent strong movement. The bearish scenario has already been mentioned, however, the euro bulls need to break through a strong and significant psychological and technical level of 1.2000 to continue the rate rise. We must admit that both warring parties have difficult tasks, and their solution is likely to require a strong driver, which may be an extended meeting of the US Federal Reserve System (FRS) on monetary policy, the results of which will be announced on Wednesday, at 19:00 London time. In addition to the rate decision itself, new economic forecasts will be published, and a press conference will be held later by Fed Chairman Jerome Powell. Without a doubt, these will be the most important events of the current week that can determine the fate of the US dollar in the medium term. In the meantime, the bullish mood for the main currency pair is still quite strong, and this can be judged by the fact that the market did not or could not work out the bearish reversal candle outlined on the chart.
Daily

On the daily chart, the range in which EUR/USD is traded is narrower - 1.1917-1.1753. Despite the continuing bullish sentiment, the strength of the euro bulls is running out at this time period. This is indicated by the long upper shadow of the candle for September 10 and the inability to overcome the very difficult mark of 1.1900. In the current situation, the euro/dollar is slightly strengthening and testing for a breakdown of the Tenkan and Kijun lines of the Ichimoku indicator. In my opinion, overcoming these lines and fixing them above them is a very important point that will allow us to try again to overcome the nearest resistance in the area of 1.1900-1.1917. If the players on the increase manage to solve this problem, their next goals will be the levels of 1.1960 and the price zone of 1.2000-1.2010.
H1

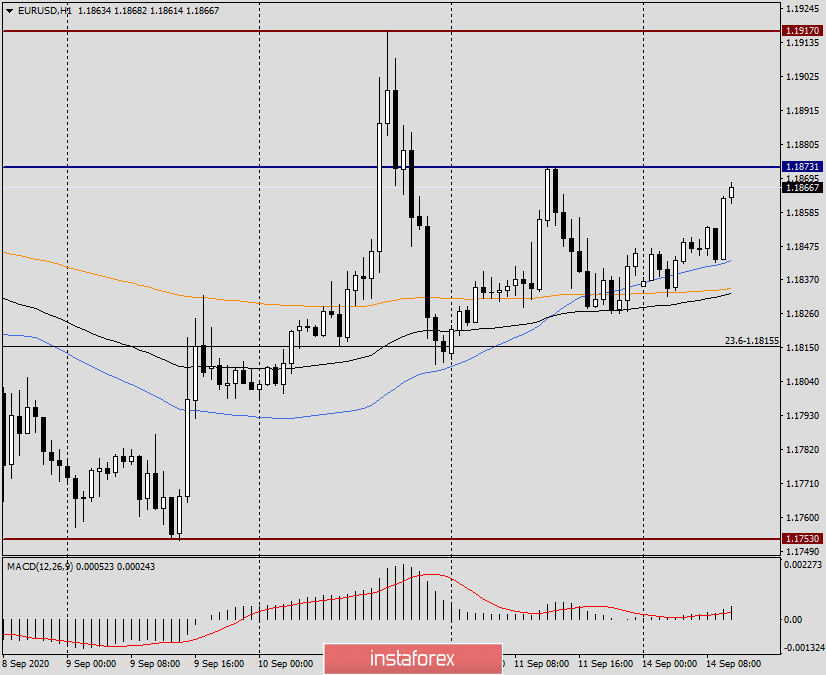
If you go to the current trading recommendations, then, taking into account the last weekly doji candle, you will still have options for both buying and selling. At the end of this article, the growth of the single European currency increased, and the pair aims to test the nearest resistance of sellers at 1.1873, where the trading highs of September 11 were shown. I suggest waiting for the breakdown of this level and fixing above it, then on the rollback to the broken mark, consider opening long positions on EUR/USD. Since the pair is trading above the moving averages used on the hourly chart, in case of a pullback, you can count on strong support, which means you can try buying from the price zone of 1.1845-1.1835.
Now for the options for sales. If the pair fails to break through the resistance at 1.1873 and reversal patterns of Japanese candlesticks appear below this level, this will be the basis for opening short positions. I recommend considering sales at more favorable prices in the case of a rise in the price zone of 1.1900-1.1917 and the appearance of similar reversal signals there.
The fundamental background will be more or less calm today, as it often happens on Mondays. No macroeconomic statistics are planned from the United States. The Eurozone will present data on industrial production at 10:00 (London time), and a meeting of the Eurogroup will be held in Brussels at 13:00 (London time). Perhaps these events will have some impact on the price dynamics of the main currency pair, although I do not think that investors will be more active until the Fed's decision.


