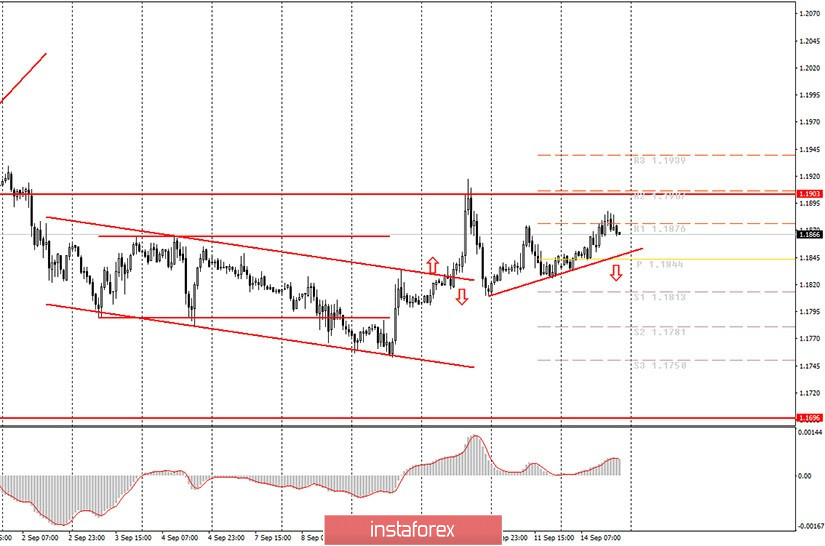
Hourly chart of the EUR/USD pair

The EUR/USD pair continued to move inside the 1.17-1.19 side channel on Monday, September 14; continued to correct against Friday's 100-point drop; continued to trade above the small and weak upward trend line. A signal did not appear during the day, which we mentioned in the morning. The price did not overcome the trend line, which would allow novice traders to resume trading on a decline. In general, trading was quite low-volatile on Monday (only 55 points passed from the high to the low of the day). The price is currently moving back to the upper line of the side channel, but we still believe that the euro/dollar pair has a better chance of resuming to move down. We do not recommend working with buy signals from the MACD indicator at this time, despite the seemingly existing upward trend (trend line). The trend is very weak, as is the trend line.
Fundamental background was practically absent on Monday for the euro and dollar. Only one more or less important report on industrial production in July in the European Union was published. It turned out that the real values of the report slightly exceeded the forecasted ones. In annual terms, the decline in production was 7.7% instead of the expected 8.2%, and in monthly terms - the increase was 4.1% instead of the forecast of +4.0%. No important messages for the day either. Once again, we remind novice traders that at this time there are several important topics that can create a certain background that will affect the pair in the long term. For example, now this background is such that the pair has been trading in a 200-point sideways channel for a month and a half. Market participants do not see the information, the data that can take the pair out of the flat. Nevertheless, the coronavirus epidemic and the upcoming US presidential elections are now of great importance for the dollar. The conflict with China seems to have been put on hold, and mass rallies and protests were suppressed.
No important macroeconomic publications either in the European Union or in the United States on Tuesday, September 15. Only a report on industrial production in America, which, like today's report on industrial production in the EU, is unlikely to cause a significant market reaction. Therefore, there is a high probability that trading will proceed in an ultra-calm channel with low volatility tomorrow. The US will sum up the results of the Fed meeting on Wednesday. Most likely, the markets will not risk in vain and force things the day before such an important event.
Possible scenarios for September 15:
1) Novice traders are still not recommended to consider buying at this time, since the price could not overcome the 1.1903 level, which is the upper line of the side channel. Therefore, moving up in the long term is canceled for now. Also, there is not a single serious pattern that would support the upward trend now.
2) Sell positions still look more attractive, only because traders could not overcome the 1.1903 level, and trading is now taking place near the upper line of the side channel of 1.17-1.19. Accordingly, it makes more sense to sell in the upper part of the side channel than to buy. We advise you to wait until the price settles below the upward trend line, which will be a good signal to sell. At the same time, we do not expect the pair to sharply fall today or tomorrow, unless strong and unexpected news comes at the disposal of traders. The nearest targets for the downward movement are the support levels of 1.1813 and 1.1781.
On the chart:
Support and Resistance Levels are the Levels that serve as targets when buying or selling the pair. You can place Take Profit near these levels.
Red lines are the channels or trend lines that display the current trend and show in which direction it is better to trade now.
Up/down arrows show where you should sell or buy after reaching or breaking through particular levels.
The MACD indicator (10,20,3) consists of a histogram and a signal line. When they cross, this is a signal to enter the market. It is recommended to use this indicator in combination with trend lines (channels and trend lines).
Important announcements and economic reports that you can always find in the news calendar can seriously influence the trajectory of a currency pair. Therefore, at the time of their release, we recommended trading as carefully as possible or exit the market in order to avoid a sharp price reversal.
Beginners on Forex should remember that not every single trade has to be profitable. The development of a clear strategy and money management are the key to success in trading over a long period of time.


