


The pair continued its upward movement on Monday after testing the resistance level 1.2919 (red bold line) then rolled back down by 71 points. Today, the upward movement may continue. No news is expected as per the economic calendar.
Trend analysis (Fig. 1).
The market may continue to move upward from the level of 1.2848 (closing of yesterday's daily candle) with the target at the resistance level 1.2929 (red bold line). In case of reaching this level, the upward trend may continue with the next target of 1.3019 - a 76.4% pullback level (blue dashed line).
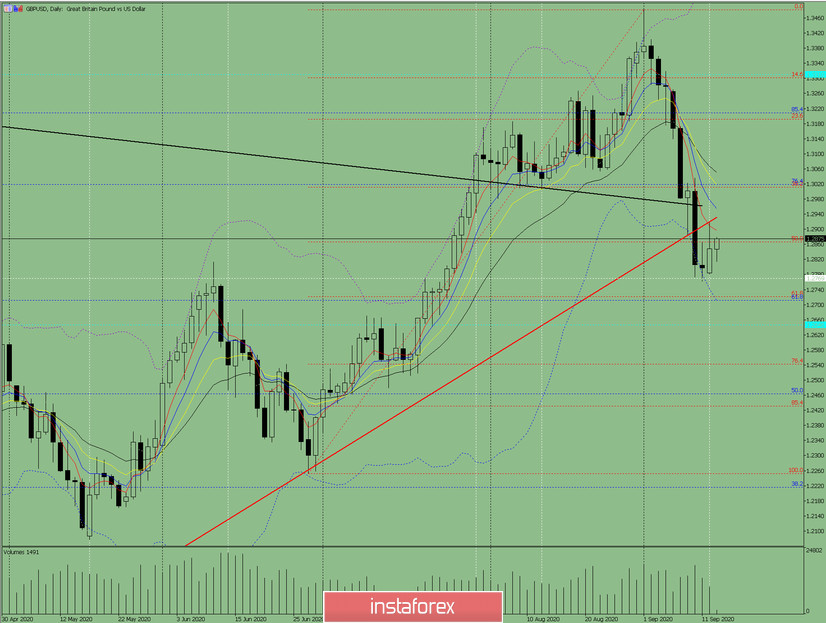
Figure: 1 (daily chart).
Comprehensive analysis:
- Indicator analysis - up;
- Fibonacci levels - up;
- Volumes - up;
- Candlestick analysis - up;
- Trend analysis - up;
- Bollinger lines - up;
- Weekly chart - up.
General conclusion:
Today, the price may continue to move upward from the level of 1.2848 (closing of yesterday's daily candle) with the target at the resistance level f 1.2929 (red bold line). In case of reaching this level, the upward trend may continue with the next target of 1.3019 - a 76.4% pullback level (blue dashed line).
Another possible scenario is an upward movement with the target at the resistance level 1.2929 (red bold line). From here, the price may move downwards with the target of 1.2866 - a 50.0% pullback level (red dotted line).


