To open long positions on EUR/USD, you need:
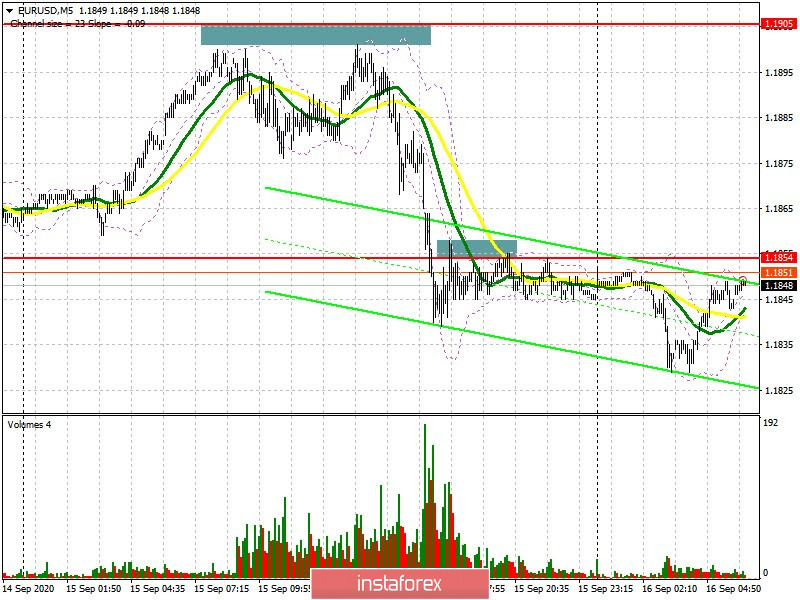
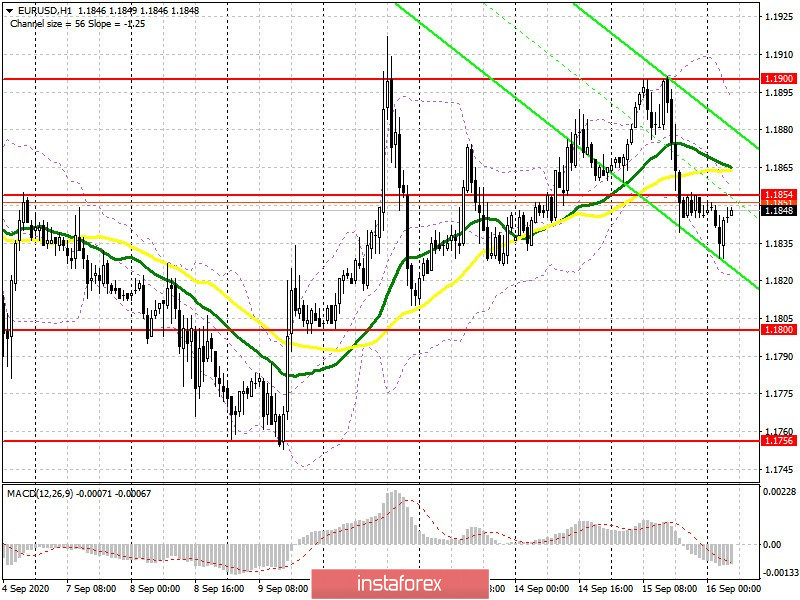
Yesterday, I did not wait for a false breakout to form at the 1.1905 level, as a result of which I had to revise this range. However, a breakout and consolidation below the support of 1.1854 was formed in the afternoon, but this did not cause the pair to sharply move down. Most likely, the bulls will try to regain this resistance in the morning, but a lot depends on the Federal Reserve's decisions on interest rates and statements that Chairman Jerome Powell will make during the press conference. The data on the eurozone foreign trade balance is unlikely to lead to changes in the market. If the Fed continues to adhere to a super-soft monetary policy, then the euro's demand may increase. Therefore, a breakout and settling above resistance at 1.1854 forms the first signal to open long positions in the hopes of updating the 1.1900 level. A breakout of this range will lead to a new wave of EUR/USD growth, allowing the pair to go out of the sideways channel. In this case, you should aim for new highs of 1.1949 and 1.1994, where I recommend taking profits. If the pressure on the euro persists, and the Fed publishes more promising economic forecasts for the next three years, it is best to postpone long positions in EUR/USD until the lower border of the 1.1800 channel is updated and a false breakout appears there. I recommend buying the euro immediately on a rebound only after the month's low has been tested in the 1.1756 area, counting on a correction of 20-30 points within the day.
Let me remind you that the Commitment of Traders (COT) reports for September 8 showed that long non-commercial positions decreased from 250,867 to 248,683, while short non-commercial positions also decreased from 54,130 to 51,869. Political uncertainty in the US and central bank meetings forced many traders to wait and see ahead of the fall marathon. As a result, the positive non-commercial net position rose only slightly and reached 196,814, against 196,747, a week earlier.

To open short positions on EUR/USD, you need:
Sellers of the euro coped with the task and managed to return the pair to the 1.1854 level, as it depended on whether the euro continued to rise to new weekly highs, or the major players would leave the market and wait for the results of the Fed meeting. And it happened. Now the bears need to defend the 1.1854 level, form the next false breakout on it and test the reverse side. Doing such forms a good entry point into short positions with the main goal of updating the low of 1.1800, where I recommend taking profits. A more distant support level will be 1.1756, but getting to it will not be easy without support from good macroeconomic indicators for the US, which are expected this afternoon. The breakout of the month's lows and testing the 1.1714 support will directly depend on the Fed's economic forecasts and the statements made by Powell. If EUR/USD demand returns, and bears miss the rather shaky 1.1854 level again, it is best not to rush to sell, but wait for the resistance test at 1.1900 and open short positions from there, subject to a false breakout. Selling the euro immediately on a rebound is best done from a more recent high of 1.1949, counting on a correction of 20-30 points within the day.

Indicator signals:
Moving averages
Trading is under the 30 and 50 moving averages, which indicates the bears' attempt to take control of the market.
Note: The period and prices of moving averages are considered by the author on the H1 hourly chart and differs from the general definition of the classic daily moving averages on the D1 daily chart.
Bollinger Bands
A break of the lower border of the indicator around 1.1820 will lead to a larger wave decline for the euro. Growth will be limited by the upper border of the indicator around 1.1890.
Description of indicators
- Moving average (moving average, determines the current trend by smoothing out volatility and noise). Period 50. It is marked in yellow on the chart.
- Moving average (moving average, determines the current trend by smoothing out volatility and noise). Period 30. It is marked in green on the chart.
- MACD indicator (Moving Average Convergence/Divergence — convergence/divergence of moving averages) Quick EMA period 12. Slow EMA period to 26. SMA period 9
- Bollinger Bands (Bollinger Bands). Period 20
- Non-commercial speculative traders, such as individual traders, hedge funds, and large institutions that use the futures market for speculative purposes and meet certain requirements.
- Long non-commercial positions represent the total long open position of non-commercial traders.
- Short non-commercial positions represent the total short open position of non-commercial traders.
- Total non-commercial net position is the difference between short and long positions of non-commercial traders.


