


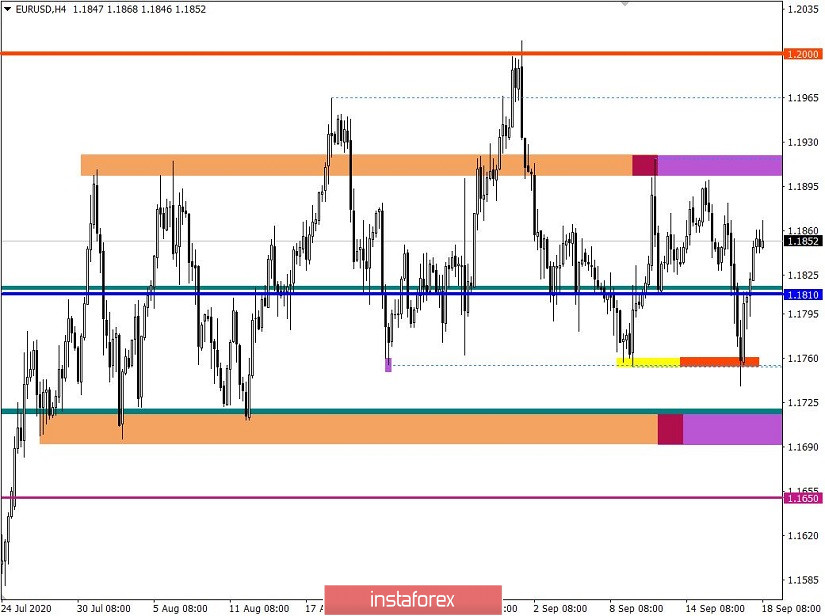
The euro/dollar pair found a pivot in the level of 1.1755, repeating the cycles on August 21, August 27 and September 9, where a slowdown occurred, followed by a price rebound. The current fluctuation has not changed the structure of the general direction in any way, the market is still inside the side channel from the levels 1.1700/1.1810/1.1910. The sideways direction has been on the market for almost seven weeks, and recently, it was possible to locally change the channel structure only twice.
A slowdown in the upward trend could serve as catalysts for new surges that will lead to a complete change in the market. Thus, the side channel is not just a platform for local positions, it is a time bomb, where there will be a movement sooner or later that will complete the closed loop process.
At this time, a signal about the completion of a closed chain of side amplitude can be a breakdown of one of the key values: 1.1700 – the development of a downward course; 1.2000 – the resumption of a medium-term upward trend.
Analyzing the last trading day by the fifteen-minute TF, we can see that the quote was in a local inertial course during the Asian session, which led us to reach the level of 1.1755. From the moment of the start of the European session to the end of the trading day, there was an upward move, which, together with the development of the level of 1.1755, brought the quote to the upper part of the flat 1.1700 // 1.1810 // 1.1910 .
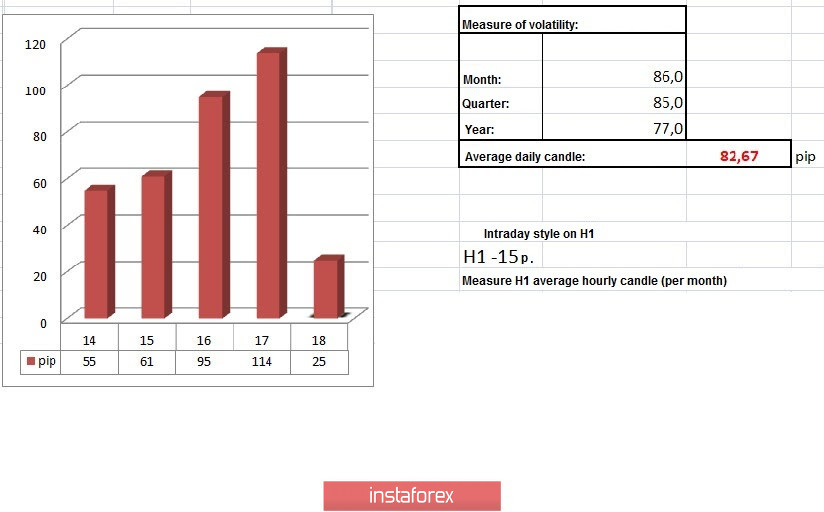
In terms of daily dynamics, the highest indicator since this trading week started is recorded at 114 points, which is 38% higher than the average level. The surge in volatility is due to the high speculative interest in the market.
Considering the trading chart in general terms (daily period), we can see the process of slowing down the medium-term trend, which was described above. A conditional ceiling is considered to be a psychological level of 1.2000.
The news background of the past day included weekly data on applications for unemployment benefits in the US, where they recorded a reduction in their volume.
Initial applications declined from 893,000 to 860,000, while repeat applications fell by almost a million, from 13,544,000 to 12,628,000.
At the time of publication of the data (12:30 Universal time), the dollar was at a stagnation stage below 1.1810.
In terms of information background, we have an interview with the head of the European Commission, Ursula von der Leyen, to the Financial Times, where she said that there is still a chance of a deal between Britain and the European Union and it is not worth wasting time.
"It is better not to be distracted by questioning the existing international agreement that we already have, and to focus on achieving it - we have little time. For us, it came as a very unpleasant surprise for the British government's attempt to renegotiate a bilateral deal negotiated last year by Prime Minister Boris Johnson himself. We remain convinced that the implementation of these agreements is possible."
According to her, problems along this path are created by attempts to change the provisions of the deal through the adoption by the British side of the bill on the internal market. She thinks that Great Britain should abandon such steps and restore trust.
There is an assumption that von der Leyen's speech regarding the fact that there is still a chance to make a deal, pushed the value of the European and British currencies solely on emotions.
Today, in terms of the economic calendar, there are no particularly important statistics for Europe and the United States. The only thing that you can pay attention to is the speeches of the presidents of the European Central Bank (ECB)
ECB Representative Mr. De Guindos - 9:15 Universal time
ECB Representative Schnabel - 14:00 Universal time

In terms of statistical data,the upcoming trading week is much more modest than this week. The only thing that can be highlighted is the preliminary assessment of the EU and US PMIs, and applications for benefits and orders for US durable goods. The main driver for jumps, as before, will be the information background associated with the Brexit deals, as well as the fate of the bill to protect the UK domestic market.
[All time zones indicated below is in Universal Time (UTC+00)]
Tuesday, September 22
USA 14:00 - Sales in the secondary housing market for August
Wednesday, September 23
EU 8:00 - Manufacturing PMI for September (preliminary)
EU 8:00 - Service PMI for September (preliminary)
USA 13:45 - Manufacturing PMI for September (preliminary)
USA 13:45 - Index of business activity in the services sector for September (preliminary)
Thursday, September 24
USA 12:30 - Claims for unemployment benefits
USA 14:00 - New Home Sales for August
Friday, September 25
USA 12:30 - Orders for durable goods for August
Further development
By analyzing the current trading chart, we can see price fluctuations at the top of the sideways channel, where buyers have won back almost 100% of the September 16-17 declines. It can be assumed that the quote's movement will remain within the values of 1.1810/1.1910, where there were local operations in terms of acceleration to this or that border relative to the current stagnation.
In terms of basic operations, it is worth seeing the price fixing outside these boundaries, where in one case there will be a rational cycle of movement to the lower flat border of 1.1700, in the other outcome an attempt is considered to make a radical change in the case of price fixing higher than 1.1920.
Based on the obtained data, it is possible to consider several development scenarios for the quote:
First, the breakdown of the limit 1.1910.
The quote returned to the original range of 1.1810/1.1910, where if the price is consolidated above 1.1920, the structure of the side channel may change, which will lead to a repetition of the plan on August 18 and September 1.
Second, a temporary swing followed by a decline.
The price movement of the upper part of the side channel 1.1700/1.1810/1.1910 leads to the accumulation of short positions, which leads to a downward move. In this scenario, the price immediately broke the average level of 1.1810, and market participants will go to the level of 1.1755 once again.
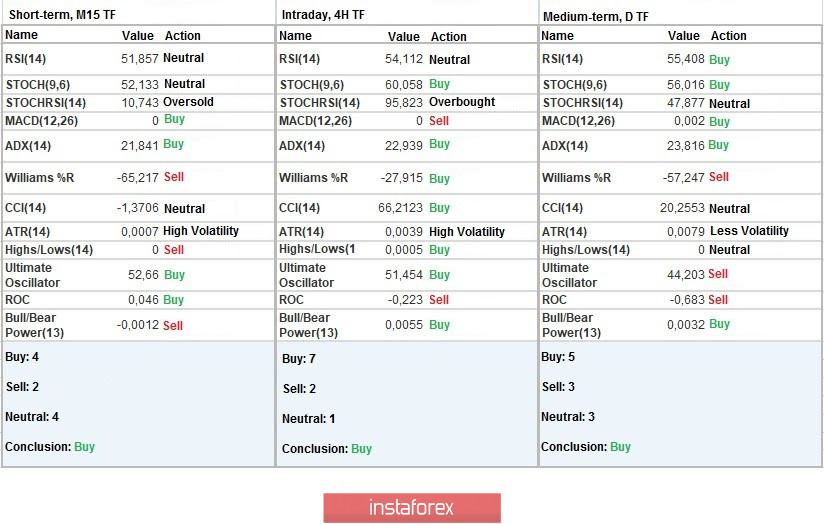
Indicator analysis
Analyzing different sectors of time frames (TF), we see that the indicators of technical instruments on the minute and hourly TF signal a buy, since the price returned to the upper part of the side channel. In turn, the daily TF has a buy signal, but the status changes to neutral due to a long flat.
Weekly volatility/Volatility measurement: Month; Quarter; Year
Measurement of volatility reflects the average daily fluctuation, calculated per Month/Quarter/Year.
(It was built considering the publication time of the article)
The volatility of the current time is 25 pips, which is 69% below the average. In any case, activity will increase by at least 100-150% relative to the current dynamics. Exceeding the indicator will depend on breaking through the main borders.
Key levels
Resistance zones: 1.1910 **; 1.2000 ***; 1.2100 *; 1.2450 **; 1.2550; 1.2825.
Support zones: 1.1800; 1.1650 *; 1.1500; 1.1350; 1.1250 *; 1.1180 **; 1.1080; 1.1000 ***.
* Periodic level
** Range level
*** Psychological level


