


The pair traded downward on Friday after its rebound to the resistance level 1.3000 (red thick line). Today, the price may resume its upward movement. Based on the economic calendar, dollar news is expected at 14:00 UTC.
Trend analysis (Fig. 1).
The market may move upward from the level of 1.2917 (closing of the Friday's daily candlestick) with the target at the resistance level 1.3014 (red bold line). If this line is tested, the upward trendd may continue with the next target of 1.3209 - an 85.4% pullback level (blue dashed line).
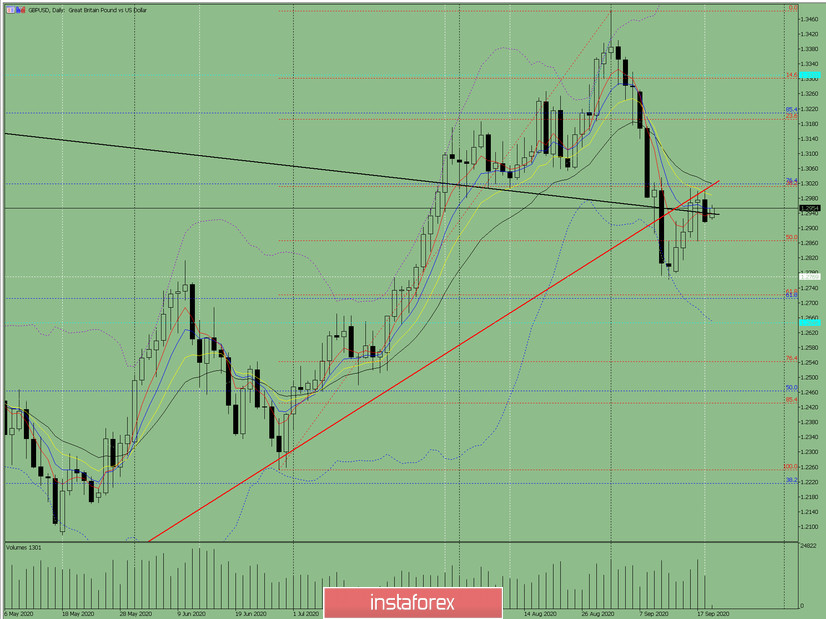
Figure: 1 (daily chart).
Comprehensive analysis:
- Indicator analysis - up;
- Fibonacci levels - up;
- Volumes - up;
- Candlestick analysis - up;
- Trend analysis - down;
- Bollinger lines - up;
- Weekly chart - up.
General conclusion:
Today, the price may continue to move upward with the target at the resistance level 1.3014 (red bold line). If this line is tested, the upward trend may continue with the next target of 1.3209 - an 85.4% pullback level (blue dashed line).
Another possible scenario: upon reaching the resistance level 1.3014 (red bold line), the price may begin to move downward with the target of 1.2866 - a 50% pullback level (red dashed line).


