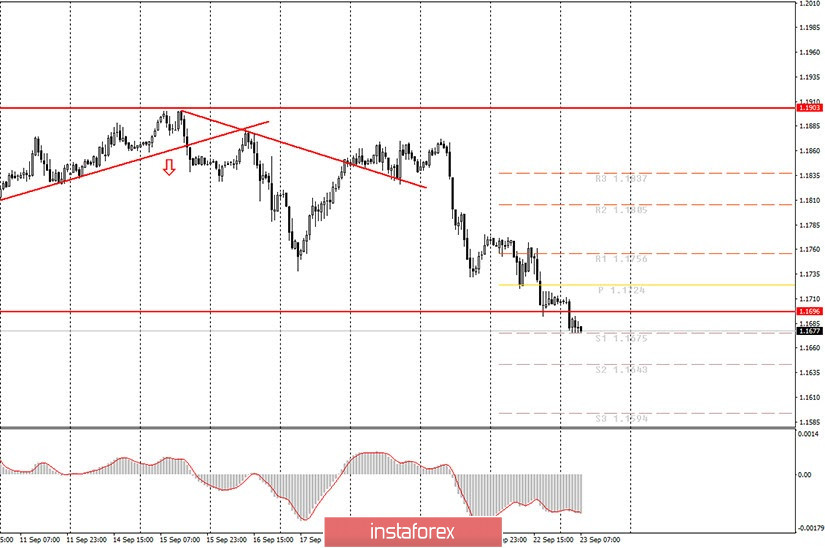
Hourly chart of the EUR/USD pair

Instead of starting a round of upward correction, the EUR/USD pair continued to decline on Tuesday night. This is rather strange, or at least unexpected, since we rarely see trend movements in overnight trading. As a rule, the pair either corrects at night or trades in a very narrow range. However, we saw a downward movement last night, and since the price was already near the lower border of the horizontal channel of $1.17-1.19, quotes settled below this line. Therefore, formally, we have the end of the sideways movement. "Formally" - because the pair has only gone 20 points below the channel so far. The downward movement continues for three consecutive days, so it is possible that an upward correction will start by today or tomorrow. Unfortunately for novice traders, it is still not possible to plot a downward trend line or a channel. Therefore, we recommend trading down at the moment, but we warn you that the risk of losses is higher without trend patterns. Moreover, due to the fact that there is no correction, the MACD indicator cannot discharge normally in order to subsequently generate clearer and more timely sell signals. Thus, even trading on the MACD indicator isn't very convenient now.
The fundamentals for the third trading day of the week are likely to be fairly mediocre. Federal Reserve Chairman Jerome Powell is set to deliver another speech in the US Congress today, however, most likely, it will exactly repeat yesterday's speech. Therefore, traders will not receive any new information. In addition, the indices of business activity in the services and manufacturing sectors will be released in the European Union and some of its countries, separately. All business activity indices are expected to remain at the same levels it was in last month, meaning, it will not change. However, if we consider the European indices separately, they are very close to the 50.0 level, below which it is believed that the area is experiencing a decline. Thus, if one or more European indicators fall below the 50.0 mark, it will be a clear bearish factor for the euro. The same goes for US PMIs. If one or more drops below 50, it could put pressure on the US dollar. However, the US PMIs are much higher than the European ones, so there is even less chance of falling below 50.0 on them.
Possible scenarios for September 23:
1) Novice traders are recommended to consider buy positions at this time, since the price has overcome the lower line of the 1.17-1.19 horizontal channel and is now aiming for a new downward trend. Since traders do not have either a channel nor a trend line at their disposal, it will be rather difficult to identify the end of a downward trend. Therefore, long positions are definitely not relevant now, according to the simplest analysis of the EUR/USD pair.
2) Selling looks reasonable, since the pair is still below the horizontal channel. At the same time, the pair has already fallen by around 200 points, which requires an upward pullback. This is not only a logical development of events, but it will also make it possible for a downward channel to appear (for example). Plus, following the trend, you are advised to open new positions only on pullbacks and corrections. If the upward pullback does not begin today, then novice traders can try to trade down, if the price settles below the first support level of 1.1675 and then you can have 1.1643 and 1.1594 as targets, without paying attention to the MACD indicator. Stop Loss is placed above 1.1675 in this case, Take Profit - slightly above the target levels.
On the chart:
Support and Resistance Levels are the Levels that serve as targets when buying or selling the pair. You can place Take Profit near these levels.
Red lines are the channels or trend lines that display the current trend and show in which direction it is better to trade now.
Up/down arrows show where you should sell or buy after reaching or breaking through particular levels.
The MACD indicator (10,20,3) consists of a histogram and a signal line. When they cross, this is a signal to enter the market. It is recommended to use this indicator in combination with trend lines (channels and trend lines).
Important announcements and economic reports that you can always find in the news calendar can seriously influence the trajectory of a currency pair. Therefore, at the time of their release, we recommended trading as carefully as possible or exit the market in order to avoid a sharp price reversal.
Beginners on Forex should remember that not every single trade has to be profitable. The development of a clear strategy and money management are the key to success in trading over a long period of time.


