


The pair traded upward on Monday and tested 1.1671 - a 14.6% pullback level (red dotted line). Today, the price may continue to move up. According to the economic calendar, dollar news is expected at 14:00 UTC.
Trend analysis (Fig. 1).
The market may move upward from the level of 1.1668 (closing of yesterday's daily candlestick) with the target at 1.1707 - a 23.6% pullback level (red dotted line). Upon testing this level, the upward trend may continue with the next target at 1.1766 - a 38.2% pullback level (red dotted line).
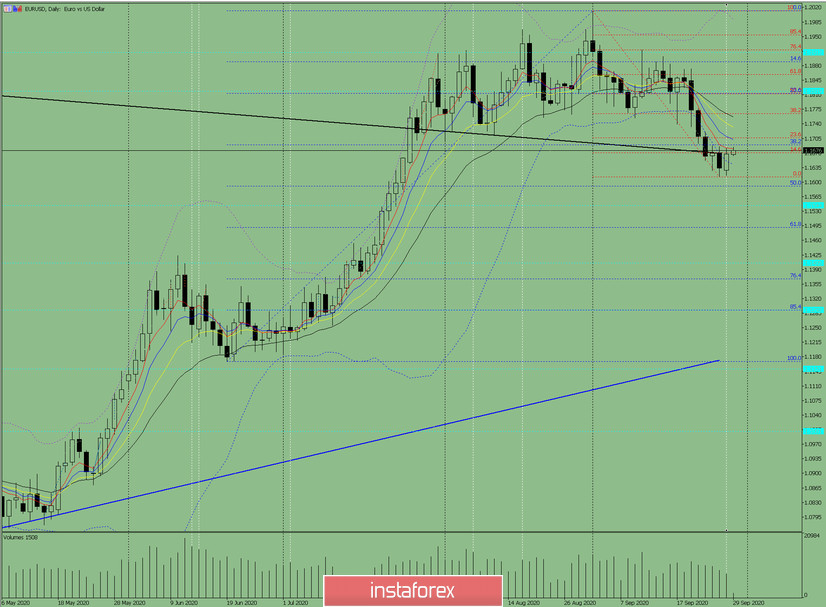
Figure: 1 (daily chart).
Comprehensive analysis:
- Indicator analysis - up;
- Fibonacci levels - up;
- Volumes - up;
- Candlestick analysis - up;
- Trend analysis - up;
- Bollinger lines - up;
- Weekly chart - up.
General conclusion:
Today, the price may move upward from the level of 1.1668 (closing of yesterday's daily candlestick) with the target at 1.1707 - a 23.6% pullback level (red dotted line). Upon testing this level, the upward trend may continue with the next target at 1.1766 - a 38.2% pullback level (red dashed line).
Another possible scenario: upon reaching the level of 1.1707 (red dotted line), the price may move down with the target at 1.1591 - a 50.0% pullback level (blue dotted line).


