


What is needed to open long deals on GBP/USD
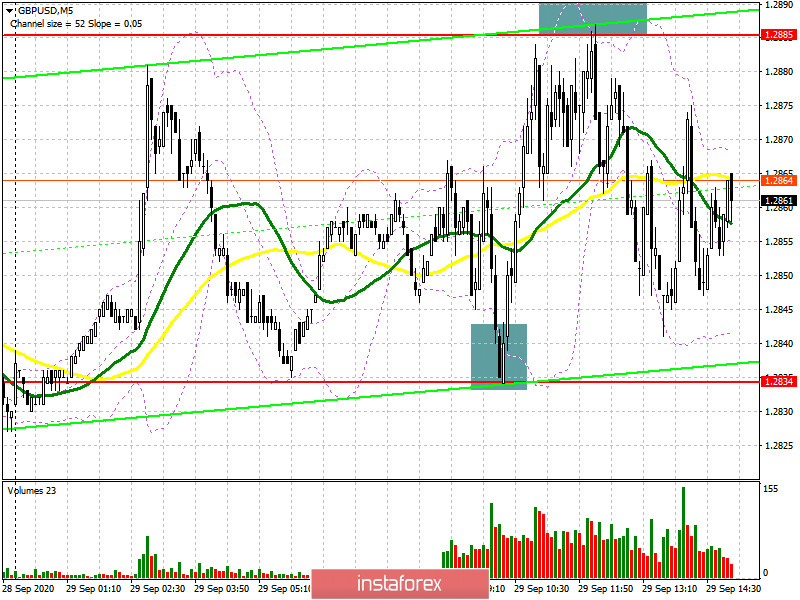
On the 5-minute chart in the first half of the trading day, the pair formed a clear signal to buy GBP from 1.2834. I turned your attention to this in my morning article. If you look at the chart, you see a fake breakout in progress at 1.2834 after the bears failed to break that level. This created a good market entry point with long positions. The pair continued its growth exactly up to 1.2885, having climbed nearly 50 pips. However, the pair couldn't surpass the level of 1.2885 the first time. If you remember, I recommended opening short deals during the same fake breakout.
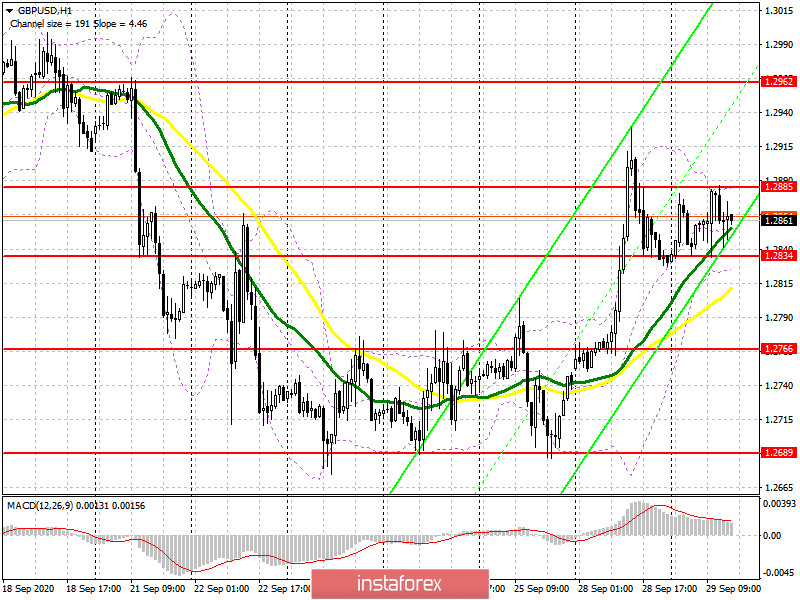
Now let's discuss the outlook for GBP/USD. From the technical viewpoint, the GBP buyers rely on the same factors. The bulls still foresee a breakout and the price fixation above 1.2885. This creates a new signal for entering the market with long positions. The main target is to hit a new one-week high of 1.2962 where I recommend profit taking. The more distant target is seen at 1.3089 but it will be hard to reach. Under the bearish scenario, another fake breakout of 1.2834 will signal opening long positions. This is going to be the second test of that level. If the bulls fail to hold the upper hand at that level, it would be better to cancel long positions until the price reaches a higher high of 1.2766. Moving averages are passing slightly higher than that which serves the needs of the bulls. Another option is to buy GBP/USD immediately during a bounce from a one-month low of 1.2689 bearing in mind a 30-40 pips intraday correction.
What is needed to open short deals on GBP/USD
In the meantime, the sellers tried to seize the market under their control but failed. They pursue the same task in the second half of the trading day. For a start, they need to ensure the price to break and stay firmly below support of 1.2834. Testing this level from the opposite side makes a good market entry point for short deals. This will dampen the buyers' optimism that will refresh the first support level of 1.2766 where I recommend profit taking. The more distant target is seen at 1.2689. If tested, this will indicate the end of the bearish trend for GBP. In case GBP/USD extends its growth, that cannot be ruled out under the current conditions, it would be better not to rush selling the pair. It would be a good idea to wait until a fake breakout at near resistance of 1.2885. Another thing, once the bears managed to secure 1.2885. So, the second test could dent their zeal to act aggressively the same way. Thus, we can sell the pair immediately during a bounce only after the price makes another one-week high of about 1.2962 bearing in mind a 30-40 pips intraday correction.
For your reference, the Commitment of Traders report from September 22 did not show any serious changes in market sentiment because traders were in the wait-and-see mood. They want to monitor how the British economy develops amid the resurgence of COVID-19. Besides, investors want to see further Brexit developments. Apparently, the sterling will come under pressure again amid the second coronavirus wave. Investors are fretted about the trade talks between the UK and EU as nothing suggests that the parties will arrive at a compromise soon. According to the COT report, the volume of short non-commercial positions decreased to 40,523 last week from 41,508. The amount of long non-commercial positions also declined to 43,801 from 43,487. As a result, the non-commercial net positions remained unchanged at 2,964 against 2,293 a week ago.
Signals of technical indicators
Moving averages
The pair is trading below 30- and 50-period moving averages. It indicates that the market is about to begin a large bullish correction.
Remark. The author is analyzing a period and prices of moving averages on the 1-hour chart. So, it differs from the common definition of classic daily moving averages on the daily chart.
Bollinger Bands
EUR growth will be capped by the upper level of the indicator at near 1.1835. In case EUR declines, the lower border of the indicator at near 1.1755 will act as support.
Definitions of technical indicators
- Moving average recognizes an ongoing trend through leveling out volatility and market noise. A 50-period moving average is plotted yellow on the chart.
- Moving average identifies an ongoing trend through leveling out volatility and market noise. A 30-period moving average is displayed as the green line.
- MACD indicator represents a relationship between two moving averages that is a ratio of Moving Average Convergence/Divergence. The MACD is calculated by subtracting the 26-period Exponential Moving Average (EMA) from the 12-period EMA. A 9-day EMA of the MACD called the "signal line".
- Bollinger Bands is a momentum indicator. The upper and lower bands are typically 2 standard deviations +/- from a 20-day simple moving average.
- Non-commercial traders - speculators such as retail traders, hedge funds and large institutions who use the futures market for speculative purposes and meet certain requirements.
- Non-commercial long positions represent the total long open position of non-commercial traders.
- Non-commercial short positions represent the total short open position of non-commercial traders.
- The overall non-commercial net position is the difference between short and long positions of non-commercial traders.


