


The pair traded upward on Thursday and tested 1.1765 - a 38.2% pullback level (red dotted line). Today, the price may move down before the news at 12:30 UTC. According to the economic calendar, euro news is expected at 09:00 UTC, and dollar news is at 12:30 UTC.
Trend analysis (Fig. 1).
The market may move downward from the level of 1.1751 (closing of yesterday's daily candlestick) with the target at the support level 1.1665 (black thick line). In case of testing this level, an upward pullback is possible to the level of 1.1765 (red dashed line). Much will depend on the market reaction to the news which comes out at 12:30 UTC.
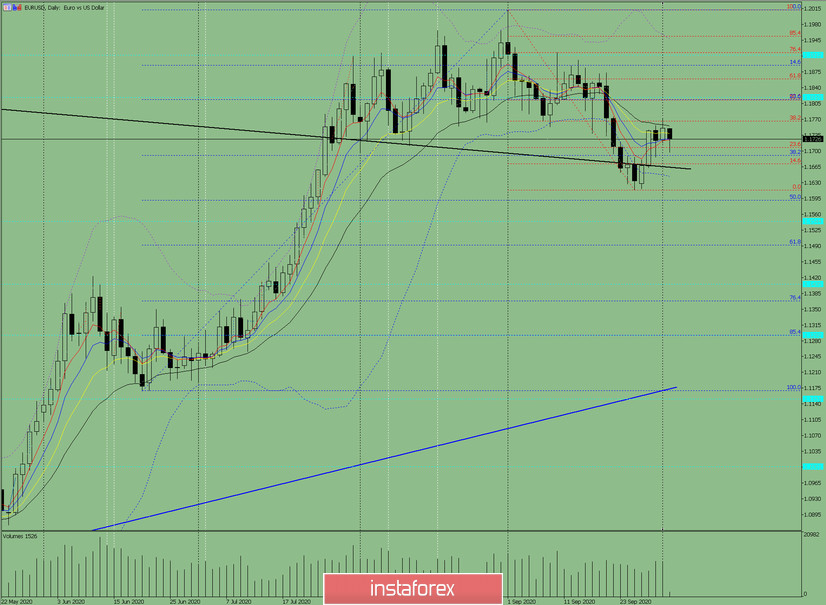
Figure: 1 (daily chart).
Comprehensive analysis:
- Indicator analysis - down;
- Fibonacci levels - down;
- Volumes - down;
- Candlestick analysis - down;
- Trend analysis - up;
- Bollinger lines - down;
- Weekly chart - up.
General conclusion:
Today, the price may move downward from the level of 1.1751 (closing of yesterday's daily candlestick) with the target at the support level 1.1665 (black bold line). In case of testing this level, an upward pullback is possible to the level of 1.1765 (red dashed line).
Another possible scenario: from the level of 1.1751, the price may move down with the target at 1.1690 - a 38.2% pullback level (blue dashed line). Upon testing this level, an upward pullback is possible with the target at 1.1812 - a 50% pullback level (red dotted line).


