


Trend analysis.
The price from the level of 1.1715 (closing of the last weekly candle) may continue to rise this week with the goal at 1.1811 - the pullback level of 50.0% (blue dashed line). After this level is tested, we can continue to work upwards with the goal of 1.1858 - the pullback level of 61.8% (blue dashed line).
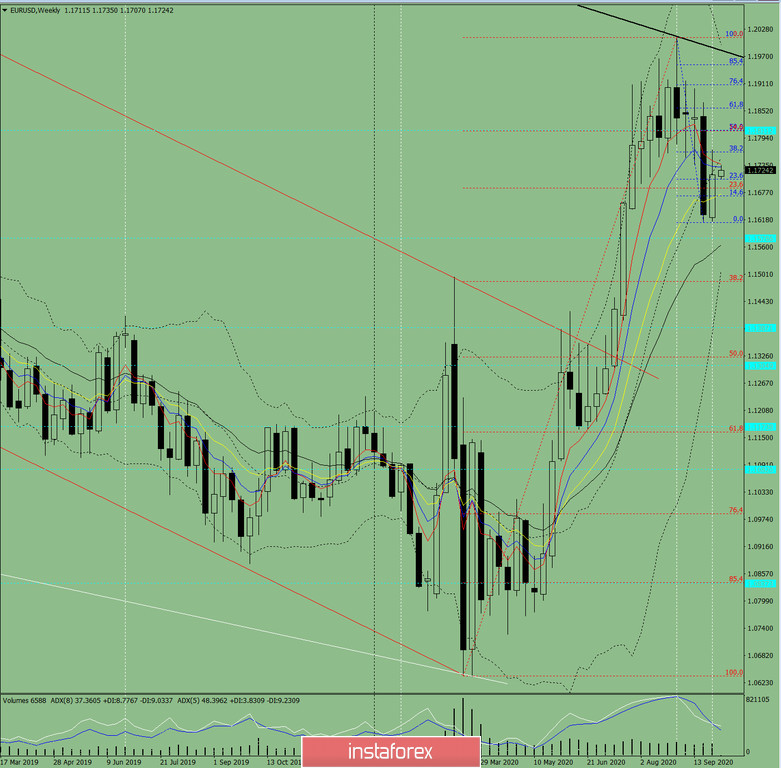
Figure: 1 (weekly chart).
Comprehensive analysis:
- indicator analysis - up;
- Fibonacci levels - up;
- volumes - up;
- candlestick analysis - up;
- trend analysis - down;
- Bollinger lines - up;
- monthly chart - up.
An upward movement can be concluded based on comprehensive analysis.
The general result of the calculation of the candlestick of the EUR/USD pair according to the weekly chart: this week, the price is likely to have an upward trend, without the lower shadow in the weekly white candlestick (Monday - up) and with the upper shadow (Friday - down).
The first upper goal is at 1.1811 - the pullback level of 50.0% (blue dotted line). If this level is tested, further growth can continue with the goal of 1.1858 - the pullback level of 61.8% (blue dashed line).
An unlikely scenario: a decline may start from the level of 1.1715 (closing of the last weekly candlestick), with the goal at 1.1579 - the historical support level (blue dotted line).


