


To open long positions on EURUSD, you need:
Low volatility in the EUR/USD pair remained in the first half of the day against the background of the lack of important fundamental statistics and new benchmarks for buyers and sellers. As a result of the low trading volume, no signals were generated to enter the market.
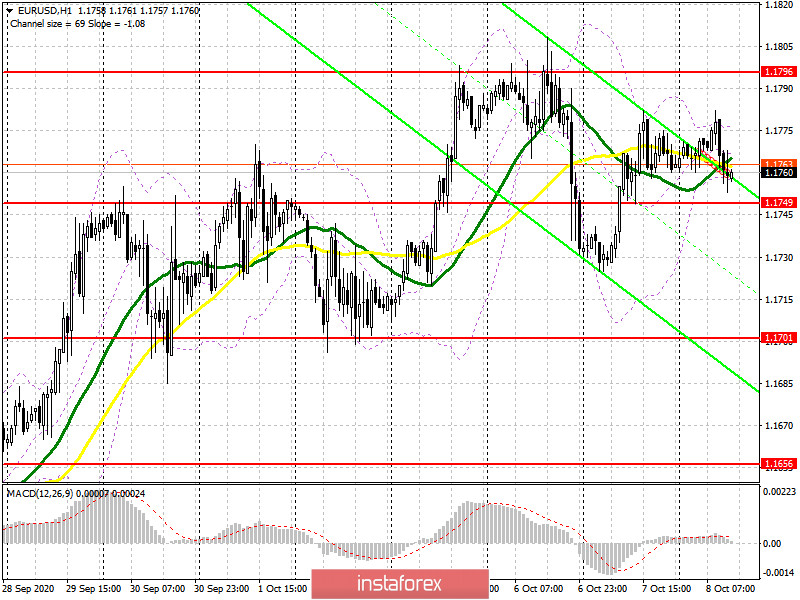
From a technical point of view, nothing has changed either. As long as trading is conducted above 1.1749, we can expect the European currency to continue recovering to the resistance area of 1.1796, where I recommend taking profit since it will not be so easy to break above this range. The focus will be shifted to the publication of the European Central Bank's minutes, thus, only a break and consolidation above 1.1796 will form a signal to open long positions in the continuation of the strengthening of EUR/USD with a test of the maximum of 1.1833, where you can also exit the market. The longer-term target remains a maximum of 1.1868. If the pressure on the euro returns, then only the formation of a false breakout at 1.1749 will be another signal to open long positions in anticipation of the continuation of the upward correction of EUR/USD. If the pair falls below 1.1749, because there is a high probability that the reluctance to buy will attract new sellers, then it is better not to hurry with long positions. The optimal scenario would be to update the major support of 1.1701, from where you can open long positions immediately for a rebound in the expectation of correction of 20-30.
To open short positions on EURUSD, you need to:
The sellers' focus today is shifted to the protection of the resistance of 1.1796. You can sell from this level by analogy with yesterday after a false breakout is formed. However, the bears' more important goal is to return to the support of 1.1749. Only fixing below this level will form a larger entry point for short positions and return the market to sellers, allowing them to reach the area of 1.1701, where I recommend fixing the profits. The longer-term target remains the area of 1.1656. The publication of the European Central Bank's minutes, which is scheduled today, may put further pressure on the euro. If the bulls achieve a breakdown of the resistance of 1.1796, it is best not to rush with sales, but wait for growth to a new maximum of 1.1833 or sell the euro immediately for a rebound from the resistance of 1.1868, based on a correction of 20-30 points within the day.
Let me remind you that the COT report (Commitment of Traders) for September 29 recorded a reduction in both long and short positions, which led to a decrease in the delta. Apparently, the lack of benchmarks and the surge in the incidence of coronavirus in Europe discouraged major players from building up long positions in the euro, however, no one is in a hurry to buy the US dollar because of the upcoming US presidential election. Thus, long non-profit positions decreased from 247,049 to 241,967, while short non-profit positions decreased from 56,227 to 53,851. The total non-commercial net position also fell to 188,116 against 190,822 a week earlier, indicating a wait-and-see attitude for new players. However, the bullish sentiment for the euro remains quite high in the medium term. The more the euro declines against the US dollar, the more attractive it will be for new investors.
Signals of indicators:
Moving averages
Trading is conducted around 30 and 50 daily moving averages, which indicates the sideways nature of the market.
Note: The period and prices of moving averages are considered by the author on the hourly chart H1 and differ from the general definition of the classic daily moving averages on the daily chart D1.
Bollinger Bands
Volatility is low, which does not give signals to enter the market.
Description of indicators
- Moving average (moving average determines the current trend by smoothing out volatility and noise). Period 50. The graph is marked in yellow.
- Moving average (moving average determines the current trend by smoothing out volatility and noise). Period 30. The graph is marked in green.
- MACD indicator (Moving Average Convergence / Divergence - moving average convergence / divergence) Fast EMA period 12. Slow EMA period 26. SMA period 9
- Bollinger Bands (Bollinger Bands). Period 20
- Non-profit speculative traders, such as individual traders, hedge funds, and large institutions that use the futures market for speculative purposes and meet certain requirements.
- Long non-commercial positions represent the total long open position of non-commercial traders.
- Short non-commercial positions represent the total short open position of non-commercial traders.
- Total non-commercial net position is the difference between the short and long positions of non-commercial traders.


