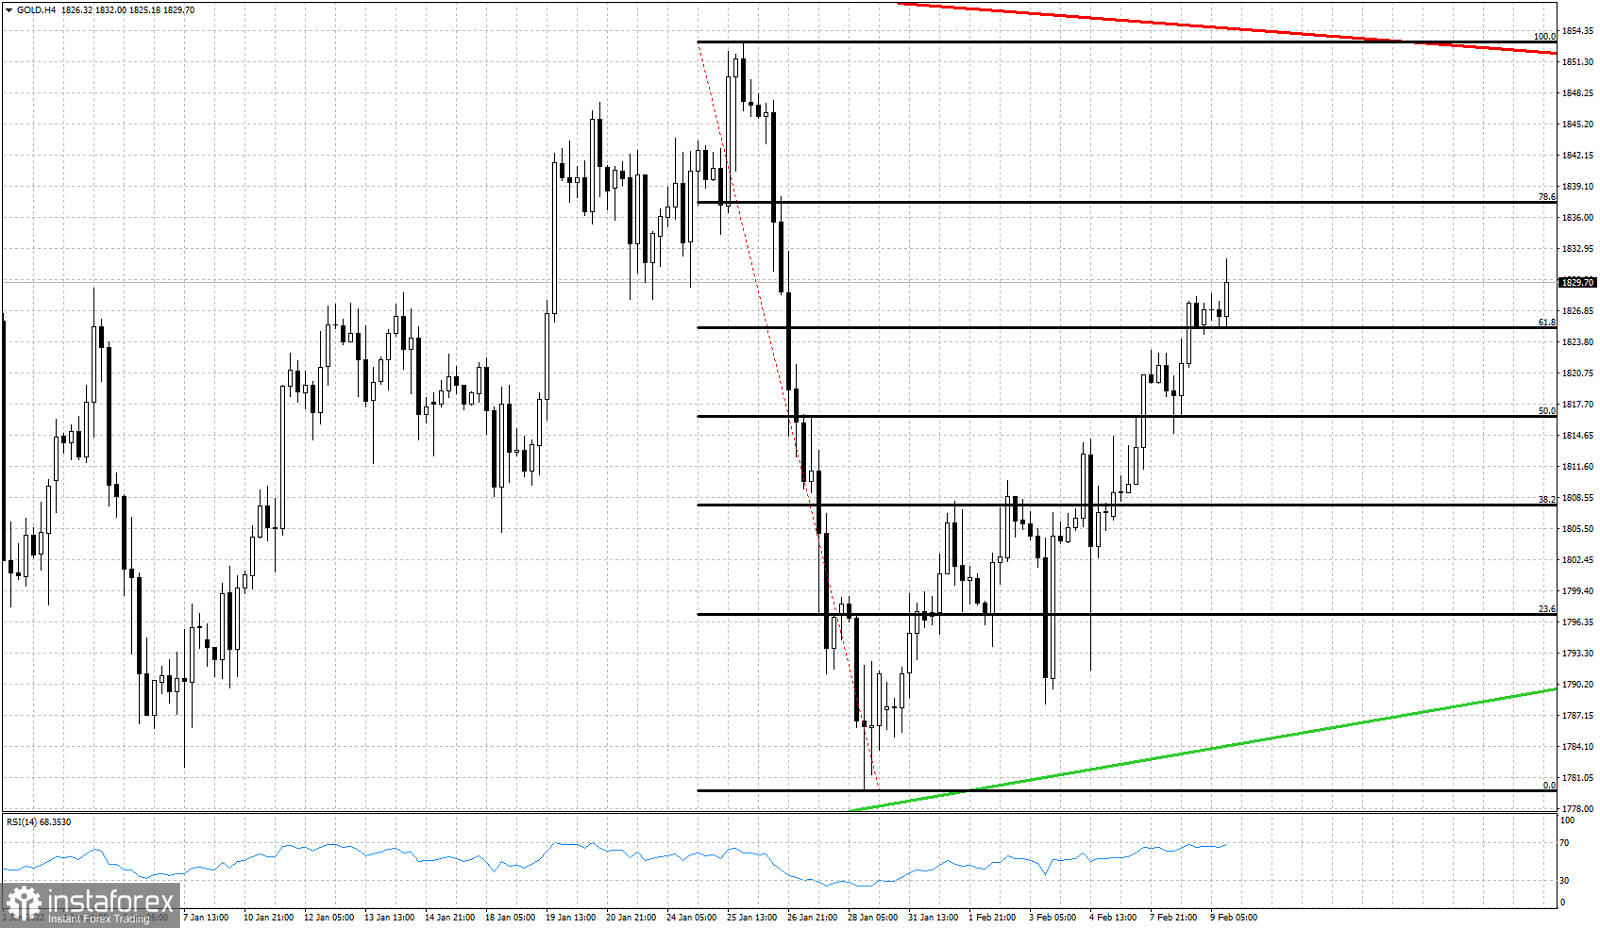
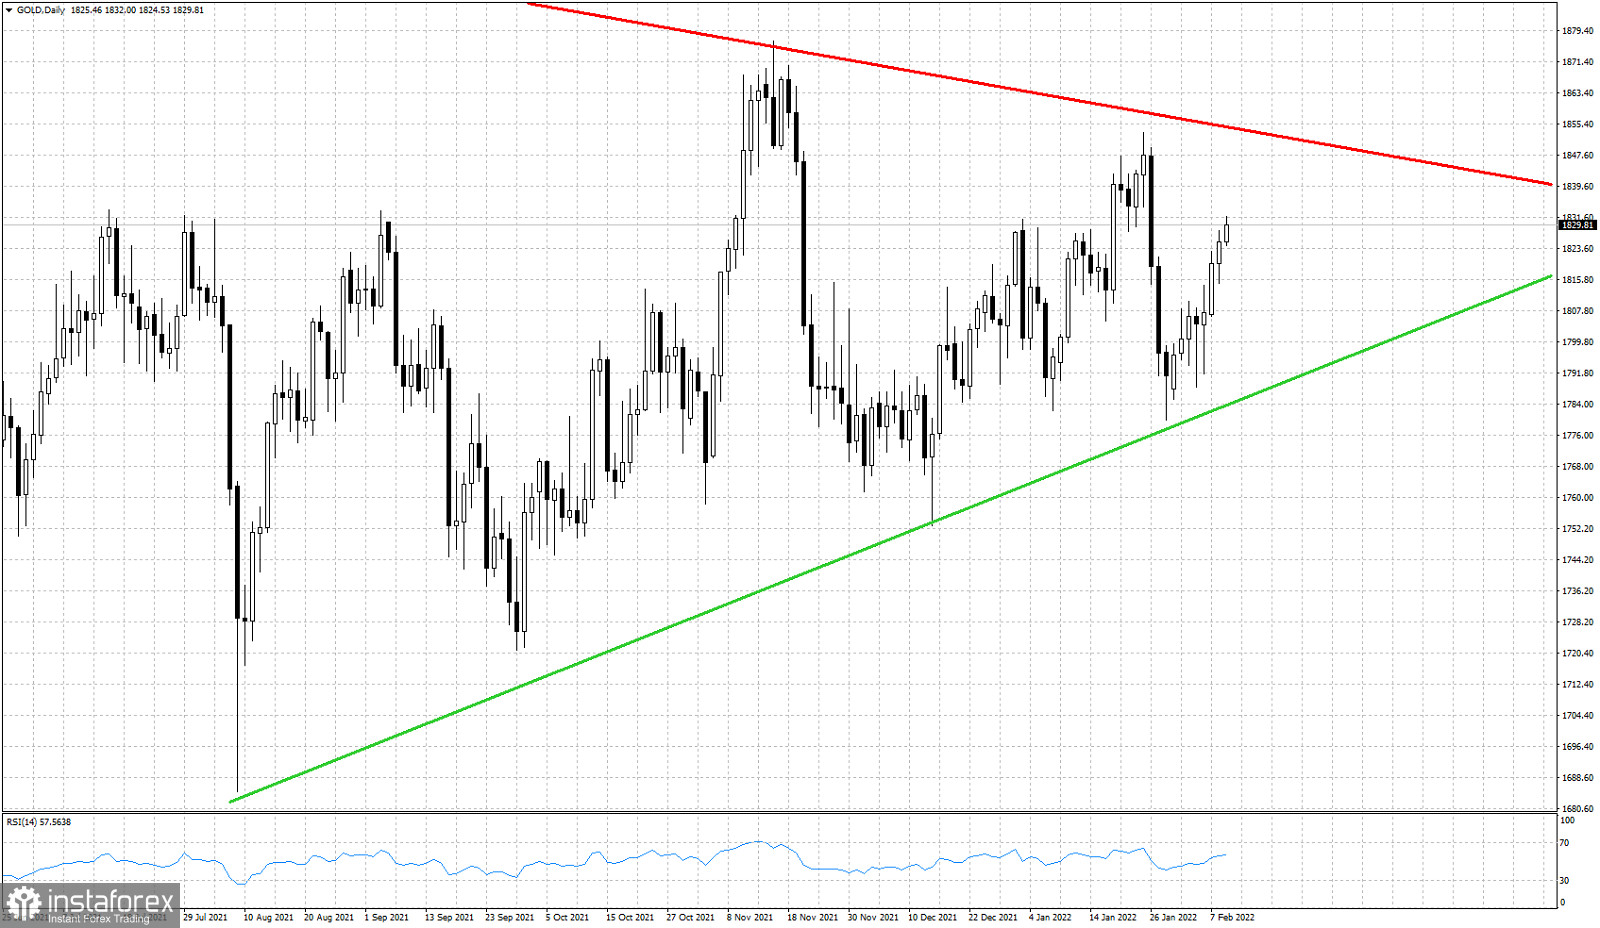
Gold price is trading around $1,830 after breaking above the 61.8% Fibonacci retracement resistance. This break out increases the chances that Gold will move higher towards $1,850-60 where we find the long-term resistance trend line.

Green line - support
Red line resistance
As shown in the 4 hour chart Gold price has broken above the 61.8% level. Price is making higher highs and higher lows. Bulls are in control of the short-term trend. Staying above $1,825-28 is key for the short-term trend. Bulls do not want to see a rejection and reversal around the 61.8% level.

Red line -resistance
Gold price is heading towards the red major trend line resistance. Gold remains trapped inside a long-term triangle pattern. Traders need to be patient. So far price continues to respect the triangle boundaries.


