


Trend analysis.
The price for this week from the level of 1.1824 (closing of the last weekly candle) may start a pullback movement down with the goal of 1.1746 – a pullback level of 38.2% (red dotted line). When testing this level, continue working down with the goal of 1.1721 – a pullback level of 50.0% (red dotted line). If you move down from the level of 1.1694, you can start working up.
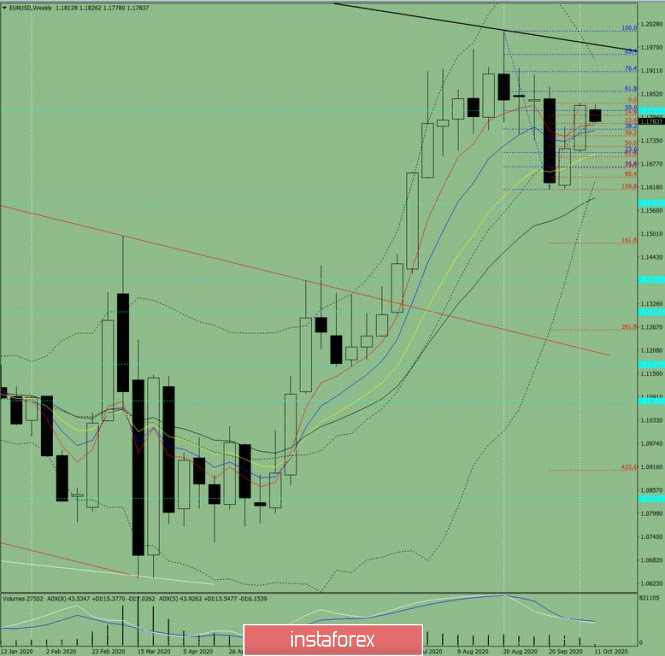
Figure 1 (weekly chart).
Comprehensive analysis:
- Indicator Analysis – Down;
- Fibonacci Levels – Down;
- Volumes – Down;
- Technical Analysis – Down;
- Trend Analysis – Down;
- Bollinger Bands – Up;
- Monthly Chart – Up.
The conclusion of the complex analysis is a downward movement.
Total calculation candles of the currency pair EUR/USD weekly chart: price of the week probably will have a downward trend movement with no upper shadows weekly black candles (Monday – down) and the presence of the lower shadow (Friday – down).
The first lower target of 1.1746 is a pullback level of 38.2% (red dotted line). When testing this level, the next lower target is 1.1721 – a pullback level of 50.0% (red dotted line).
Unlikely scenario: from the level of 1.1824 (closing of the last weekly candle), a downward movement with the target of 1.1746 – a pullback level of 38.2% (red dotted line). When testing this level, work up with the goal of 1.1830 – the upper fractal (red dotted line).


