


EUR/USD
Analysis:
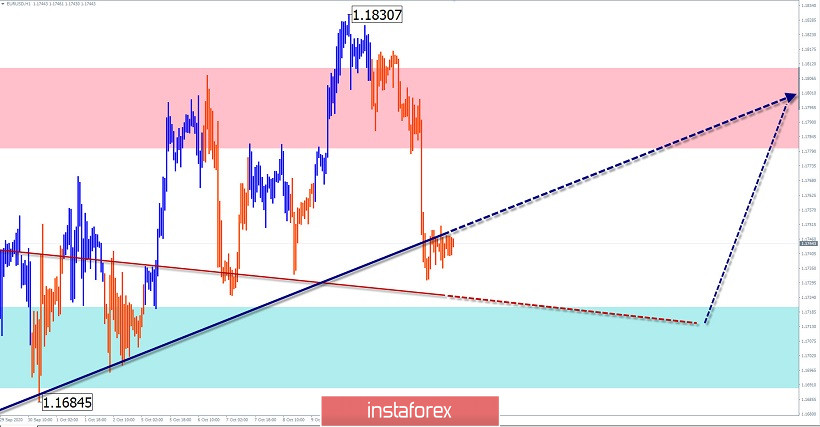
The European currency chart is dominated by an upward trend. The correction phase has recently ended. On September 25, a new section started following the trend. In recent weeks, a stretched plane of hidden correction has been developing. The movement exceeded the preliminary scope. The wave structure is nearing completion.
Forecast:
The entire corrective wave is expected to end within the next day. As part of the calculated support, then there will be a reversal and the beginning of price growth. A breakout of the upper limit of the resistance zone is unlikely today.
Potential reversal zones
Resistance:
- 1.1780/1.1810
Support:
- 1.1720/1.1690
Recommendations:
Until the current correction is completed, it is better to refrain from entering the euro market. After the reversal signals appear in the area of settlement support, it is recommended to look for signals to buy the pair.
AUD/USD
Analysis:
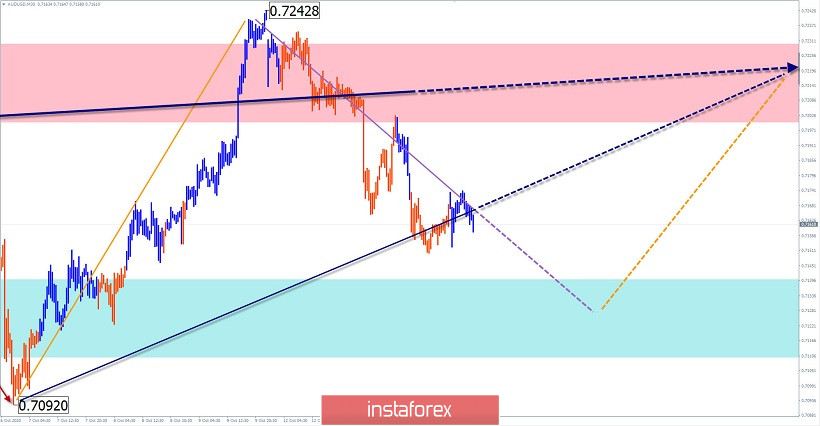
The "Aussie" market is dominated by a bullish trend. Its scale is close to the weekly TF. The last section in the main direction counts down from September 25. In the wave structure, the middle part (B) is completed. In recent days, the price is adjusted within the last section (C).
Forecast:
There is a high probability that the current decline will end within the limits of the calculated support. At the end of the day or tomorrow, you can expect the beginning of price growth. The resistance zone shows the upper limit of the expected daily range of the pair's move.
Potential reversal zones
Resistance:
- 0.72000/0.7230
Support:
- 0.7140/0.7110
Recommendations:
Trading in the "Aussie" market today is only possible in the framework of intraday. When selling, you should take into account the limited potential for reduction. After the reversal signals appear, you should focus on the pair's purchases.
GBP/JPY
Analysis:
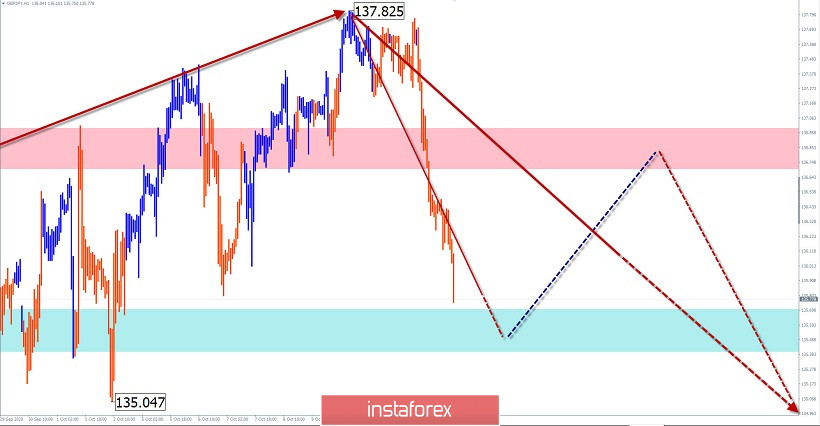
The dominant trend direction of the British cross on the daily chart scale is set by the downward wave from June 5. Over the past month, the price has been forming an intermediate correction within the last section (C). The price decline that began two days ago may be the beginning of a reversal pattern before the price moves down again.
Forecast:
In the next trading sessions, there is a high probability that the rate decline will end. From the calculated support, you can expect a price rebound to the resistance area. A breakthrough beyond the calculated boundaries of the designated zones is unlikely today.
Potential reversal zones
Resistance:
- 136.70/137.00
Support:
- 135.70/135.40
Recommendations:
Buying on the pair's market today can be risky. It is safer to refrain from entering the pair's market during the pullback and look for sell signals at its end.
Explanation: In the simplified wave analysis (UVA), waves consist of 3 parts (A-B-C). The last incomplete wave is analyzed. The solid background of the arrows shows the formed structure, and the dotted background shows the expected movements.
Note: The wave algorithm does not take into account the duration of the instrument's movements in time!


