


Trend analysis (Fig. 1).
Today, the market will try to continue moving down from the level of 1.2937 (closing of yesterday's daily candle) in order to reach the support line of 1.2814 (red bold line). If this line will be tested, a further work up to the target of 1.2983 will have a pullback level of 38.2% (blue dotted line).
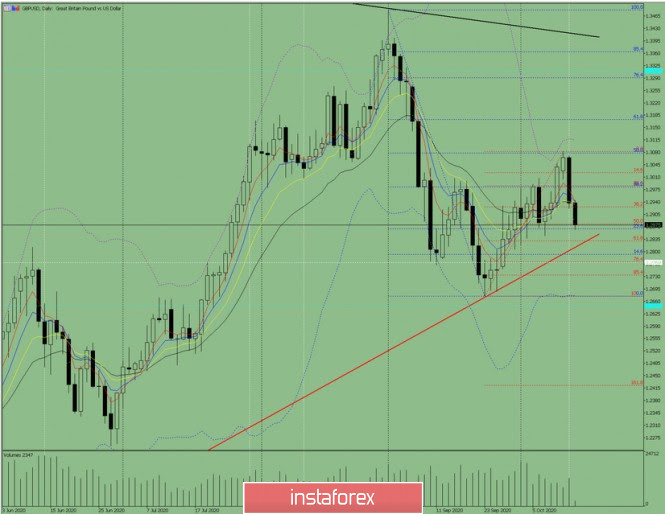
Figure 1 (daily chart).
Complex Analysis:
- Indicator Analysis – Down
- Fibonacci Levels – Down
- Volumes – Down
- Technical Analysis – Down
- Trend Analysis – Down
- Bollinger Bands – Down
- Weekly Chart - Down
General conclusion:
Today, the price from the level of 1.2937 (closing yesterday's daily candle) will try to continue moving down to reach the support line of 1.2814 (red bold line). If this line will be tested, a further work up will have a target of 1.2983 with a pullback level of 38.2% (blue dotted line).
Alternative scenario: the price from the level of 1.2937 (closing of yesterday's daily candle) will try to continue moving down with the goal of reaching the 50% pullback level – 1.2878 (red dotted line). In the case of testing this level, further work up will have a target of 1.2982 that will roll back to the level of 38.2% (blue dotted line).


