


Moving downwards, the pair tested the support line 1.2863 (red bold line) before the price went up quite strongly, almost testing the pullback level of 50% - 1,3078 (blue dotted line) yesterday. Today, the price may continue to move downwards. Market news is expected at 12:30 and 3:00 UTC (USD)
Trend analysis (Fig. 1). on
The market will try to continue moving down from the level of 1.3013 (closing of yesterday's daily candle). The target is 1.2926 with a pullback level of 38.2% (red dotted line). When this level is reached, the support line (red bold line) will continue to work down with the target at 1.2873.
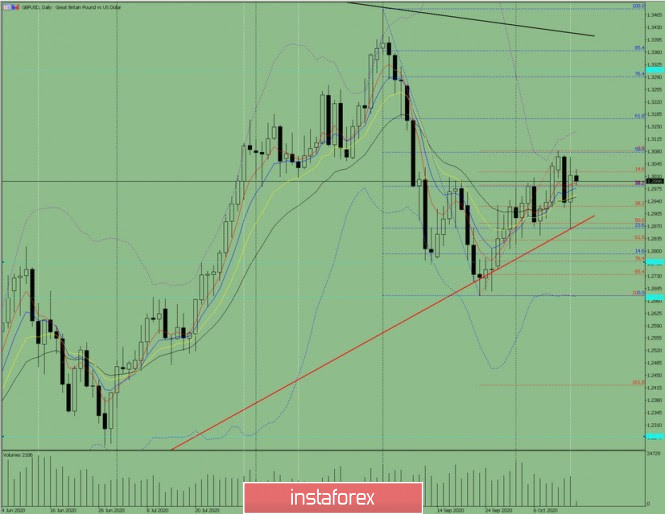
Figure 1 (daily chart).
Complex Analysis:
- Indicator analysis – down
- Fibonacci levels – down
- Volumes – down
- Technical Analysis – down
- Trend Analysis – up
- Bollinger Bands – up
- Weekly Chart - down
General conclusion:
The price will try to make a downward movement with the goal of 1.2926 and a pullback level of 38.2% (red dotted line). When this level is reached, the support line (red bold line) will continue to work down with the target at 1.2873.
Alternative scenario: From the level of 1.3013 (closing of yesterday's daily candle), the pair will try to move down with the goal of 1.2986 and a pullback level of 23.6% (red dotted line). From this level, they will go up with the goal of 1.3083 upper fractal (red dotted line).


