


Trend analysis (Fig. 1).
Today, the market from the level of 1.2911 (closing of yesterday's daily candle) will try to continue moving down with the target of 1.2883 – the support line (red bold line). When this line will be reached, the price can start moving up with the next target of 1.2983 – a pullback level of 38.2% (blue dotted line). In testing this level, a further work going up with the target of 1.3083 is the upper fractal (red dotted line).
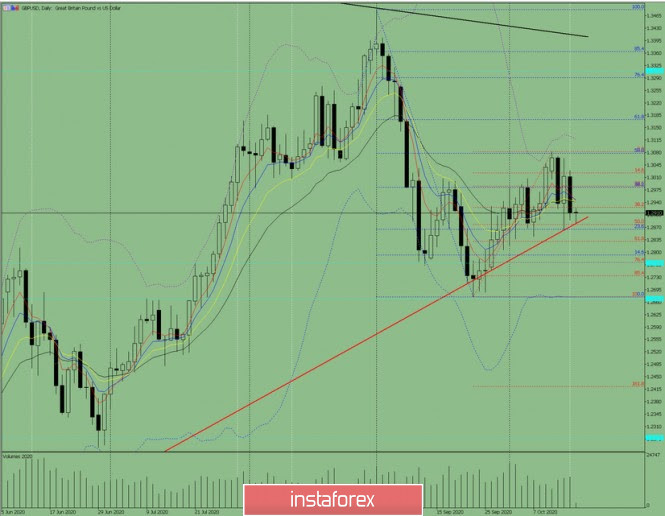
Figure 1 (daily chart).
Complex Analysis:
- Indicator Analysis – up
- Fibonacci Levels – up
- Volumes – up
- Candle Analysis – up
- Trend Analysis – up
- Bollinger Bands – down
- Weekly Chart - up
General Conclusion:
Today, the price from the level of 1.2911 (closing of yesterday's daily candle) will try to continue moving down with the target of 1.2883 – the support line (red bold line). When this line will be reached, the price can start moving up with the next target of 1.2983 – a pullback level of 38.2% (blue dotted line). In testing this level, a further work going up with the target of 1.3083 is the upper fractal (red dotted line).
Alternative scenario: when moving down and testing the support line 1.2883 (red bold line), the continuation of the downward movement to the next target 1.2831 is a rollback level of 61.8% (red dotted line).


