


Last Friday, the pair moved in a sideways channel and tried to break through the retracement level of 50% - 1.2878 (red dashed line). Today the price is likely to continue its upward movement based on the economic calendar news expected at 12.00 UCT (dollar).
Trend analysis (Fig. 1).
Today, the market from the level of 1.2919 (closing of Friday's daily candle) may continue to move upward with the target of 1.2983 - the retracement level of 38.2% (blue dotted line). When testing this level, it is possible to continue working upward with the target at 1.3078 - the retracement level of 50.0% (blue dashed line).
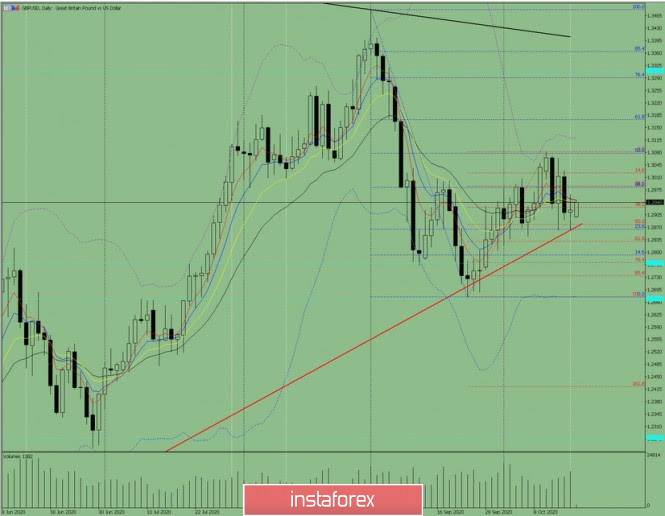
Figure: 1 (daily chart).
Comprehensive Analysis:
- Indicator Analysis - up
- Fibonacci Levels - up
- Volumes - up
- Candlestick Analysis - up
- Trend Analysis - up
- Bollinger Lines - up
- Weekly Chart - up
General conclusion:
Today the price will try to start moving upwards with the target at 1.2983 - the 38.2% retracement level (blue dotted line). When testing this level, it is possible to continue working upward with the target at 1.3078 - the retracement level of 50.0% (blue dashed line).
Unlikely scenario: from the level of 1.2919 (the close of Friday's daily candlestick), the price may start moving upward with the target of 1.2983 - a retracement level of 38.2% (blue dotted line). When testing this level, there'll be further work going down with the target of 1.2873 - support line (red bold line).


