Main Quotes Calendar Forum
flag

FX.co ★ Ichimoku cloud indicator analysis on EURUSD.

parent
Forex Analysis:::2022-02-13T18:15:05

Ichimoku cloud indicator analysis on EURUSD.

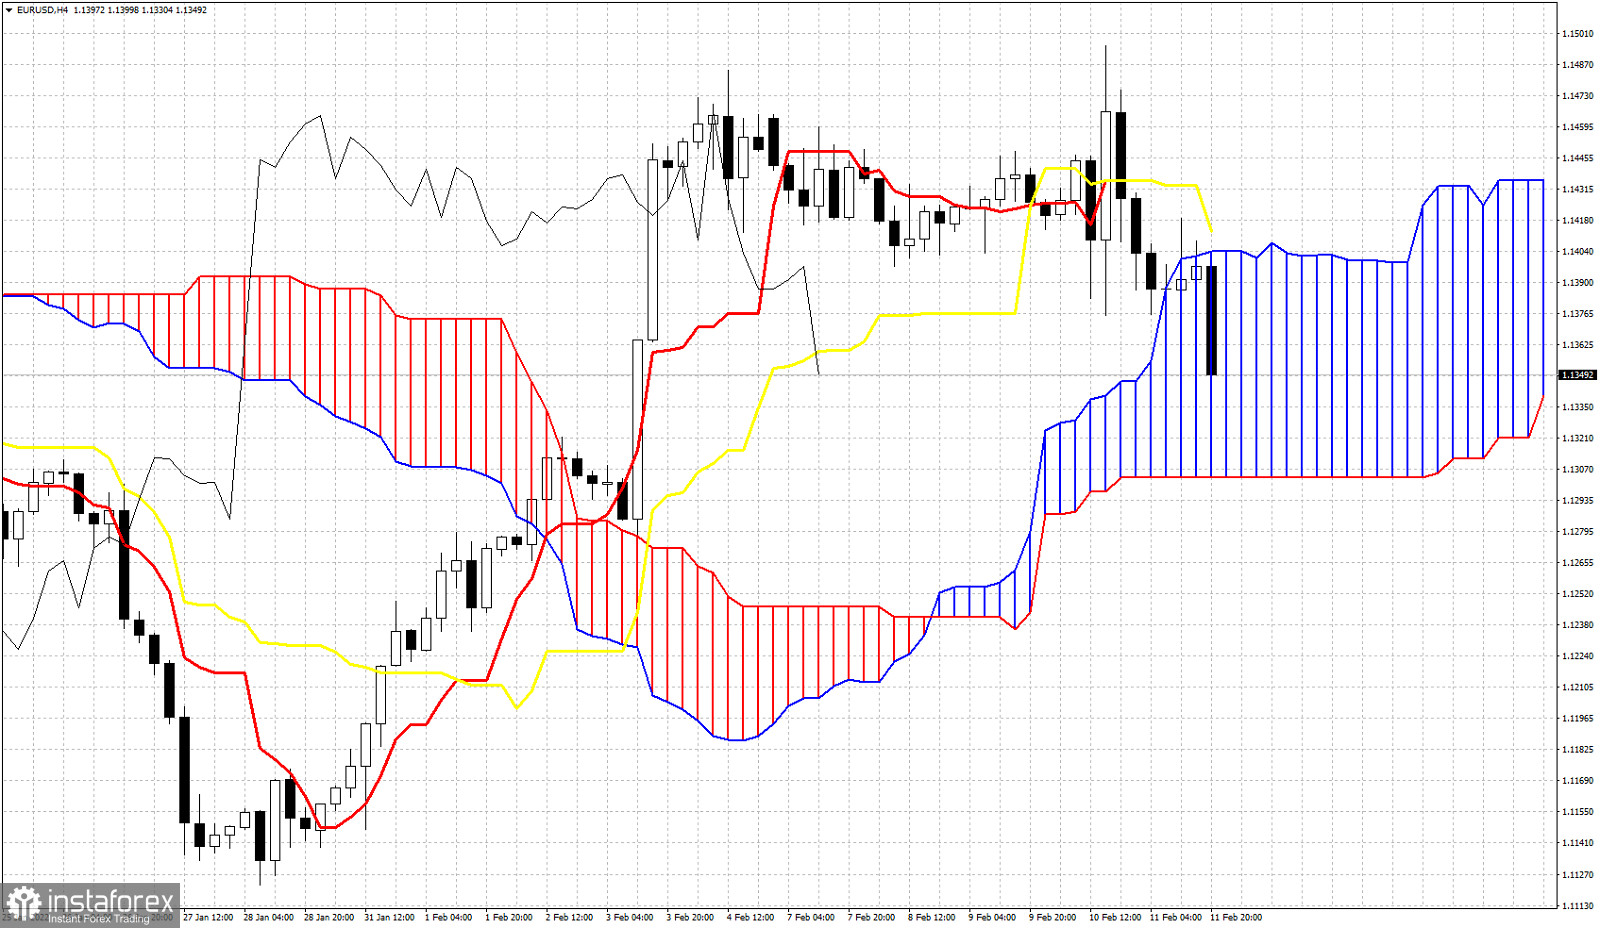
Last week EURUSD ended near its weekly lows after making new weekly highs at 1.1495. Price has entered the Daily Kumo. This is not good for bulls. In Ichimoku cloud terms, price is in a neutral trend as long as it trades inside the Kumo (cloud).

Ichimoku cloud indicator analysis on EURUSD.

The upper cloud boundary is important short-term resistance at 1.1405. Bulls need to recapture this level in order to remain in control of the trend. Price is vulnerable to a move lower towards the lower cloud boundary at 1.13. Bulls do not want to see price break below the 1.13 level. This would be a bearish sign in Ichimoku cloud terms. The Kijun-sen (yellow line indicator) is at 1.1412 with a negative slope. This is another obstacle that bulls must surpass. EURUSD is in a corrective pull back. A move above 1.14-1.1410 will be a sign that the uptrend is resuming.
Analyst InstaForex
Share this article:
parent
loader...
all-was_read__icon
You have watched all the best publications
presently.
We are already looking for something interesting for you...
all-was_read__star
Recently published:
loader...
More recent publications...