


At the auction on October 12-16, the Japanese yen was the only major currency that strengthened against the US dollar. However, this strengthening turned out to be very insignificant and amounted to 0.16%. It can be assumed that in this currency pair, the Trump administration's inability to agree with the Democrats on the adoption of a new package of stimulus measures fueled demand for the Japanese yen as the main safe-haven currency. Also, the expectation of the results of the US presidential election and the technical picture, which we are considering right now, have an impact on the course of trading on USD/JPY.
Weekly
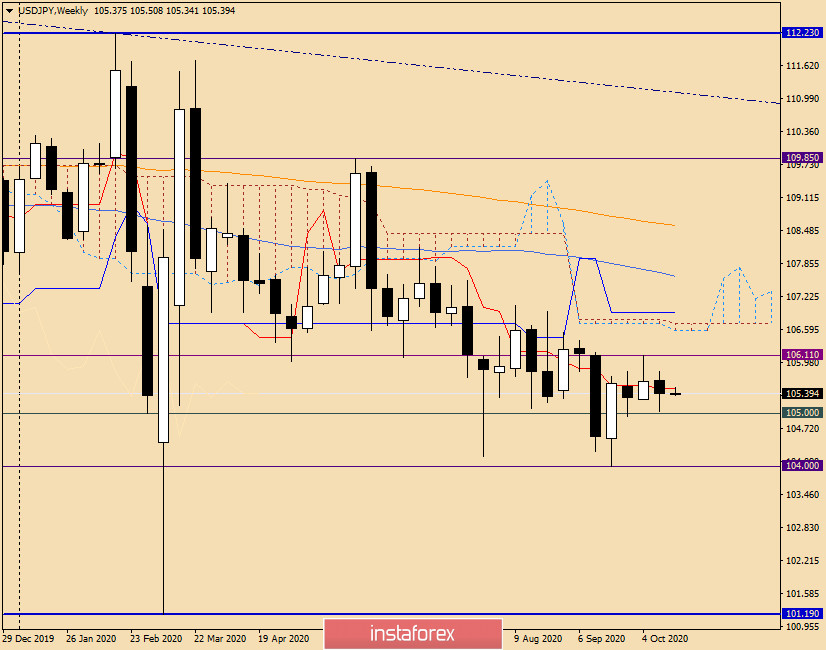
According to the last two weekly candles, it becomes clear that market participants are in a state of uncertainty about the further progress of the exchange rate. This is indicated by the small bodies of the last two candles and, accordingly, their upper and lower shadows are quite long. It is also worth noting that the pair can not detach from the red Tenkan line of the Ichimoku indicator, which attracts the price like a magnet. If you look at the trading range in which the dollar/yen has been trading for the past five weeks, it can be designated as 106.00-104.00. At the same time, in the last three weeks, the bulls on the instrument have been resolutely defending the significant technical and psychological level of 105.00, not letting the quote fall below this important mark.
Due to this technical picture, it is reasonable to assume that a true breakout of 105.00 will send the pair to the next support around 104.00. If the traders manage to break through the 106.00 mark and close trading above the resistance level of 106.11, the next target at the top will be the price zone of 106.60-106.90, where both borders of the Ichimoku cloud pass, as well as the blue Kijun line. Looking at the weekly timeframe, it is quite problematic to determine the further direction of the pair. Let's see what kind of picture is observed in smaller time intervals.
Daily
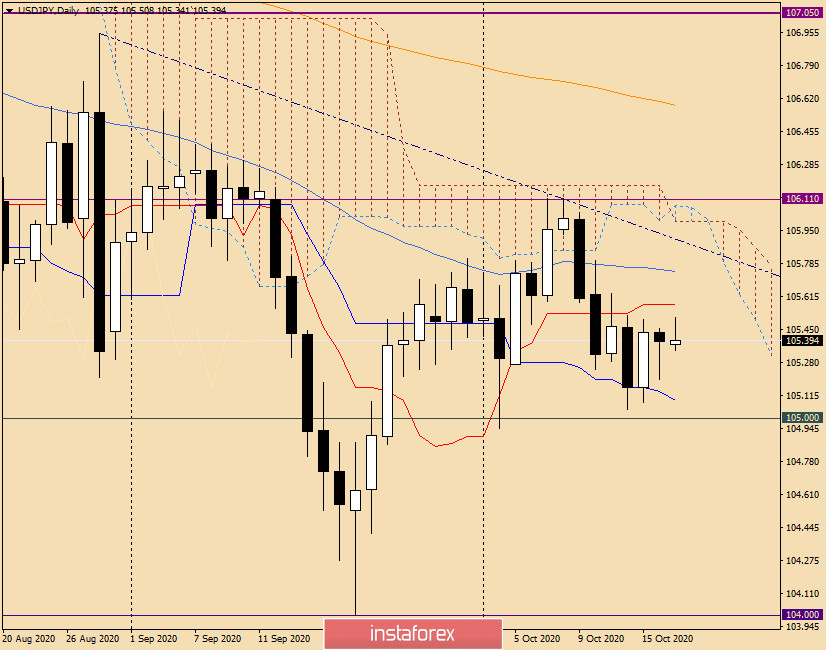
There is no more clarity on the daily chart. The pair is trading between the Kijun (105.09) and Tenkan (105.58) lines, which represent support and resistance, respectively. Characteristically, the Kijun is right above the 105.00 mark, which reinforces the already iconic level as support. However, the Tenkan breakout will not particularly clarify the situation, since the simple moving average passes above 50, the resistance line of 106.95-106.11, both borders of the Ichimoku cloud, as well as the resistance level of 106.11, where the maximum trading values were shown on October 8.
I fully assume that such uncertain dynamics in a relatively narrow trading range will continue until the results of the US presidential election are announced. At the same time, it is not clear which candidate's victory will support the US currency.
Today can determine the positioning for this currency pair. If a candle with a long upper shadow appears below the 106.00 level, this will be a signal to open sales with targets of 105.00 and 104.00. If the bears are unable to push a significant level of 105.00 and a candle with a long lower shadow appears, you can try buying with goals in the area of 105.75-106.00. Today's trading on USD/JPY may be influenced by the speech of Fed Chairman Jerome Powell, as well as comments from members of the US Federal Open Market Committee Richard Clarida, Patrick Harker, and Raphael Bostic.


