


In this review, we will look at the technical picture of the dollar/franc currency pair and try to find interesting and technically sound options for positioning.
Weekly
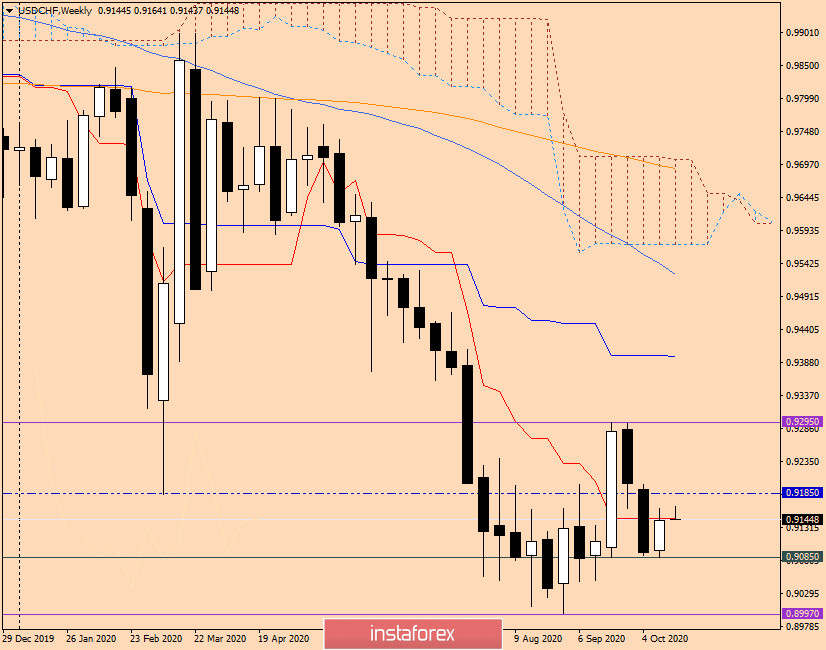
Following the results of the past week's trading, the USD/CHF pair rose by 0.66% and closed the session at 0.9143. This is slightly below the Tenkan red line, which runs at 0.9146, but now, trading on USD/CHF is conducted near 0.9162. The pair shows preparedness to continue climbing. In case of a bullish scenario, the nearest possible growth targets will be a broken, or rather, cut support level of 0.9185. The longer-term goal of the bulls for this instrument will be a strong resistance of sellers near the important level of 0.9300. I believe that only a true breakdown of this mark will indicate a bullish scenario for the dollar/franc and open the way to higher goals.
Bears have an equally difficult task in the pair. First, they must update the previous lows at 0.9085, and then storm to break the landmark psychological and technical level of 0.9000, where a very strong support was indicated.
Daily
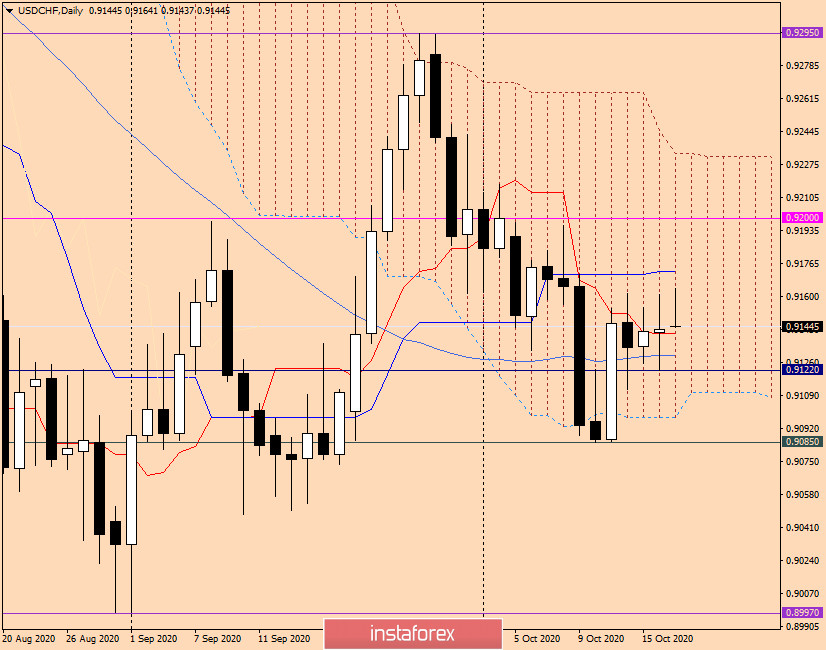
On the daily chart, the dollar/franc pair is trading approximately in the middle of the Ichimoku indicator cloud, which itself is an area of uncertainty. In order to implement a bullish scenario, it is necessary to go up the blue Kijun line of the Ichimoku indicator, which is located at 0.9172. If this mission is successful, the next goal of players to increase the rate will be a strong level of 0.9200, right below which the maximum values of several trading days were shown, in particular on October 8 and 5. And then, for further implementation of the upward scenario, it is necessary to bring the price up from the Ichimoku indicator cloud and storm the most important resistance level 0.9300 for a breakdown. Once again, I am emphasizing that only a true breakdown of this mark will indicate that the USD/CHF bulls have the strength to further lift the rate.
Bears will take control of trading on the pair after going under the Tenkan line and updating the previous Friday lows at 0.9122. After that, sellers need to bring the price down from the Ichimoku cloud and break through the support at 0.9085. If this happens and the pair consolidates at 0.9085, it is likely that the decline will resume to the key support level of 0.9000, where the subsequent direction of the quote will be decided.
H4
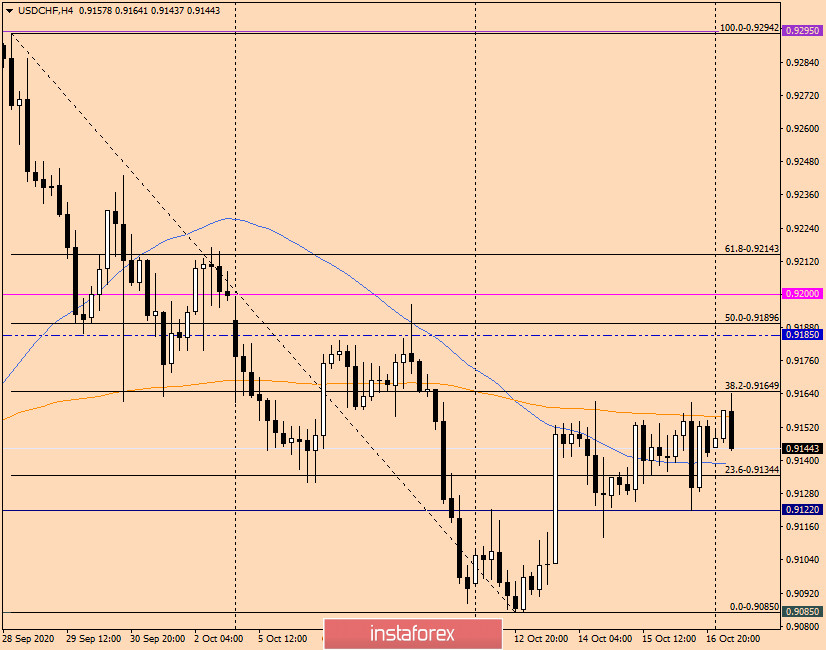
On the four-hour chart, the pair is in a local downward trend. The grid of the Fibonacci tool was stretched to a decrease of 0.9294-0.9085. The pair corrected to the level of 38.2 from this downward movement, after which it can turn down and resume the downward trend. In my opinion, it is important to note that at the end of this article, attempts are made to break through the 200 Exponential Moving Average. If the pair consolidates above the 200 EMA, then the rollback to this moving average can be considered the opening of long positions. If a bearish candlestick analysis pattern appears below the 200 exponent, a signal will appear to open sell trades. Since it is still quite difficult to make an unambiguous conclusion about the future direction of the price at this moment, it is recommended to consider positioning in both directions, but open trades only after the appearance of clear candlestick signals on the daily, four-hour, and hourly time frames.


