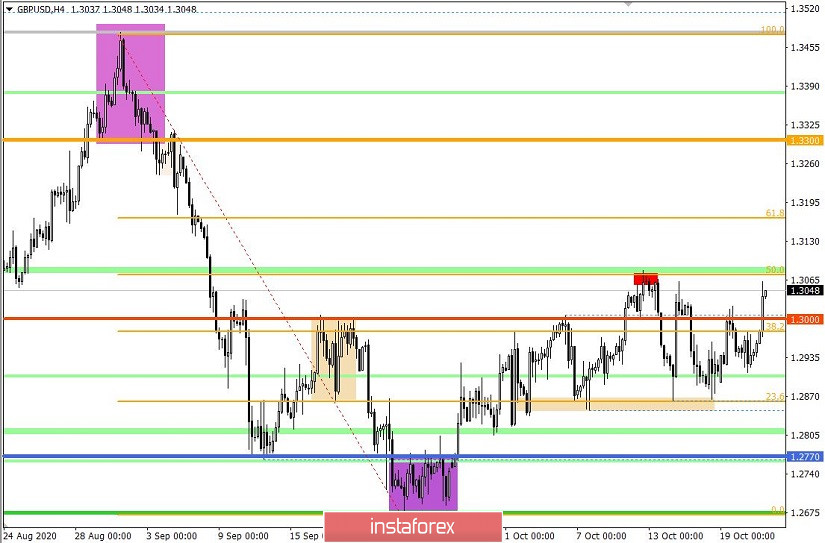
The GBP / USD pair continues to move on the flow of speculative activity, where the levels 1.2860; 1.3000; 1.3060 / 1.3080 are considered the areas of interaction of trade forces.
As of the moment, the market is at a stage of correction (which started from the local low of 1.2674), where, relative to the scale of the decline in September (1.3480 ---> 1.2674), there is a recovery by about 50%.
A similar situation is observed in the European currency (EUR / USD), but in it, the correction is replaced by a recovery relative to the main trend.
Anyhow, if we look at the M15 chart and analyze the trades set up yesterday, we will see that the quotes formed a V-shaped pattern, but it was closed when the pound broke out of the upper border of the previous price range.
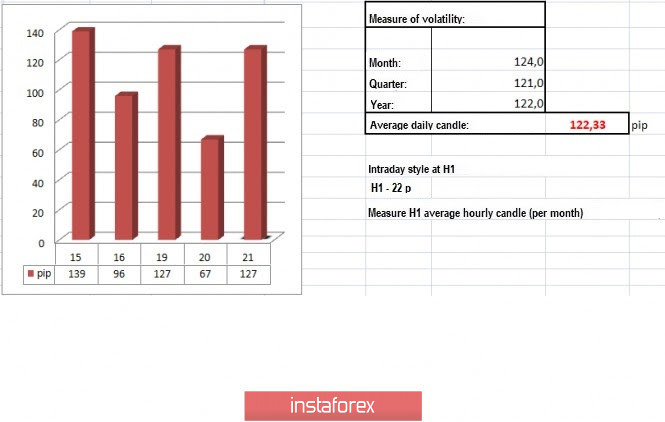
In terms of daily dynamics, a low indicator of 67 points was recorded, but if we look closely at the hourly time frame, we will see that activity only fell when the quotes formed the V-shaped pattern. A low activity is a proven signal for an upcoming acceleration, which, at the moment, we can already see in the market.
As for the daily chart, the quote has already reached the peak of the correction, and it is one step away from updating the local high.
With regards to news, a rather good data on the US construction sector was published, where the volume of construction increased by 2.8% against the expected 1.9%, while the number of issued building permits increased by 5.2% against the forecast of 1.8%.
Brexit negotiations are also leaning more to a positive outcome, as according to the statements of EU chief negotiator Michel Barnier, although the dialogues last week did not yield desired results, a trade deal is still within reach.
At the same time, Barnier addressed the issue over sovereignty and said: "what is at stake in these negotiations is not the sovereignty of one or the other side. The principles of the EU respect British sovereignty, which is the legitimate concern of the UK government. "

A report on the UK's inflation rate was published today, but instead of an increase to 0.4%, a rise to 0.5% was recorded.
Further development
As we can see on the trading chart, the pound rose in the market, during which the quote once again consolidated above the psychological level of 1.3000. However, it failed to move past 1.3060 / 1.3080, which affected the volume of long positions.
Nevertheless, it is assumed that if the quote fails again to consolidate higher than 1.3080 in the four-hour time frame, a downward movement will follow, and it would be towards levels lower than 1.3000.

Indicator analysis
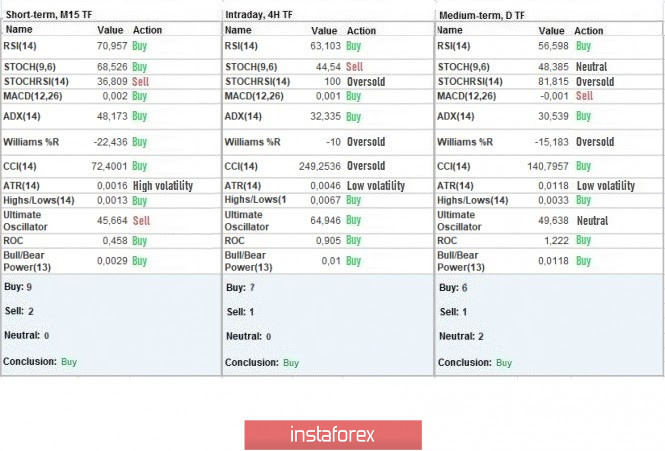
Looking at the different sectors of time frames (TF), we can see that the indicators on the hourly and minute time frames signal BUY due to the speculative price movement, while the daily time frame signals BUY due to the price consolidation above 1.3000.

Weekly volatility / Volatility measurement: Month; Quarter; Year
Volatility is measured relative to the average daily fluctuations, which are calculated every Month / Quarter / Year.
(The dynamics for today is calculated, all while taking into account the time this article is published)
Volatility is currently at 127 points, which is 3% below the average level.

Key levels
Resistance zones: 1.3200; 1.3300 **; 1.3600; 1.3850; 1.4000 ***; 1.4350 **.
Support Zones: 1.3000 ***; 1.2770 **; 1.2620; 1.2500; 1.2350 **; 1.2250; 1.2150 **; 1.2000 *** (1.1957); 1.1850; 1.1660; 1.1450 (1.1411).
* Periodic level
** Range level
*** Psychological level
Also check the trading recommendations for the EUR/USD pair here, or brief trading recommendations here.


