


Trend analysis (Fig. 1).
Today, the market from the level 1.1862 (closing of yesterday's daily candle) may begin moving down with the goal of 1.1819, which is a pullback level of 23.6% (blue dotted line). When testing this level, further work down with the goal of 1.1780, which is a pullback level of 38.2% (blue dotted line).
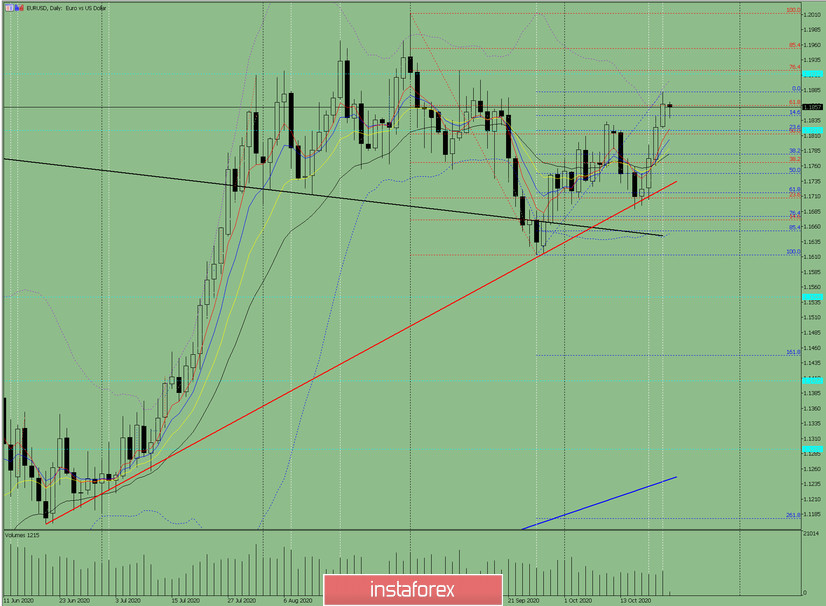
Figure 1 (Daily chart).
Complex analysis:
- Indicator analysis - down
- Fibonacci levels - down
- Volumes - down
- Technical analysis - down
- Trend analysis - down
- Bollinger Bands - down
- Weekly chart - down
General conclusion:
Today, the market may start moving down from the level of 1.1862 (closing of yesterday's daily candle) with the target of 1.1819, which is a pullback level of 23.6% (blue dotted line). When testing this level, further work downward with the goal of 1.1780, which is a pullback level of 38.2% (blue dotted line).
Alternative scenario: from the level of 1.1862 (closing of yesterday's daily candle), the price may continue to move down with the target of 1.18144, which is a pullback level of 14.6% (blue dotted line). When testing this level, further work up with the goal of 1.1882 - the upper fractal (blue dotted line).


