


Trend Analysis (Fig. 1).
Today, the market may continue to move downward from the level of 1.1820 (closing of yesterday's daily candle) with the target at 1.1780 - the retracement level of 38.2% (blue dotted line). In case of testing this level, there will be a work going down to the level of 1.1748 - the 50% retracement level (blue dashed line).
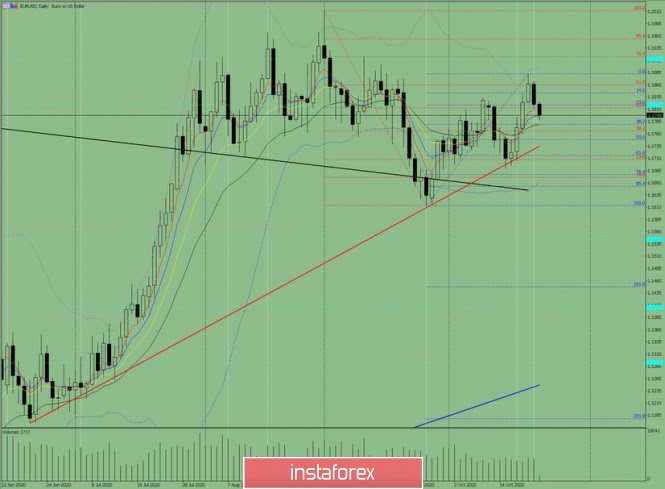
Figure: 1 (daily chart).
Comprehensive Analysis:
- Indicator Analysis - down
- Fibonacci Levels - down
- Volumes - down
- Candlestick Analysis - down
- Trend Analysis - up
- Bollinger Lines - down
- Weekly Chart - up
General conclusion:
Today, the price from the level of 1.1820 (closing of yesterday's daily candle) may continue to move downward with the target of 1.1780 - the retracement level of 38.2% (blue dashed line). In case of testing this level, there will be a work going down to the level of 1.1748 - the 50% retracement level (blue dashed line). Then top work is possible.
Alternative scenario: from the level of 1.1820 (closing of yesterday's daily candle) may continue to move down with the target at 1.1780 - a retracement level of 38.2% (blue dashed line). In case of testing this level, there will be a work going up to the level of 1.1860 - the retracement level of 61.8% (red dashed line).


