


Trend Analysis (Figure 1)
Today, the market may begin moving up from the level of 1.1808 (closing of yesterday's daily candle) with the goal of 1.1853, which is a pullback level of 61.8% (blue dotted line). Upon testing this level, the price will further work up, with the goal of 1.1876 - the resistance line (blue dotted line).
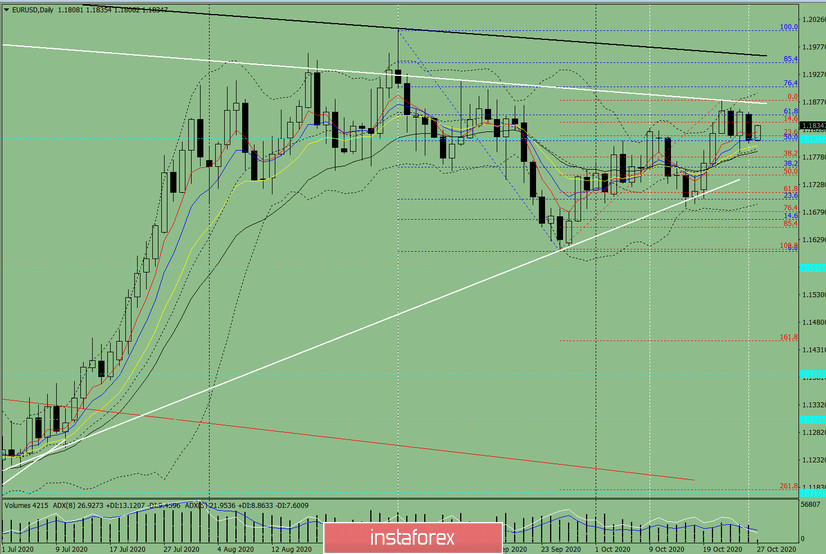
Figure 1 (Daily chart)
Comprehensive analysis:
- Indicator analysis - up
- Fibonacci levels - up
- Volumes - up
- Candlestick analysis - up
- Trend analysis - up
- Bollinger Bands - up
- Weekly chart - down
General conclusion:
Today, the price from the level of 1.1808 (closing of yesterday's daily candle) may continue to move up with the goal of 1.1853, which is a pullback level of 61.8% (blue dotted line). Upon testing this level, the price will further work up, with the goal of 1.1876 - the resistance line (blue dotted line).
Unlikely scenario: when working up to reach the pullback level of 61.8%, which is 1.1853 (blue dotted line), work down with the goal of 1.1777, which is a pullback level of 38.2% (red dotted line).


