


Trend analysis (Figure 1)
Today, from the level of 1.1786 (closing of yesterday's daily candlestick), the market may continue to move down with the goal of 1.1756 - the support line (white bold line). If this line is tested, further upward work is possible with the goal of 1.1807, which is the 50% pullback level (blue dotted line). From this level, it is possible to work upward.
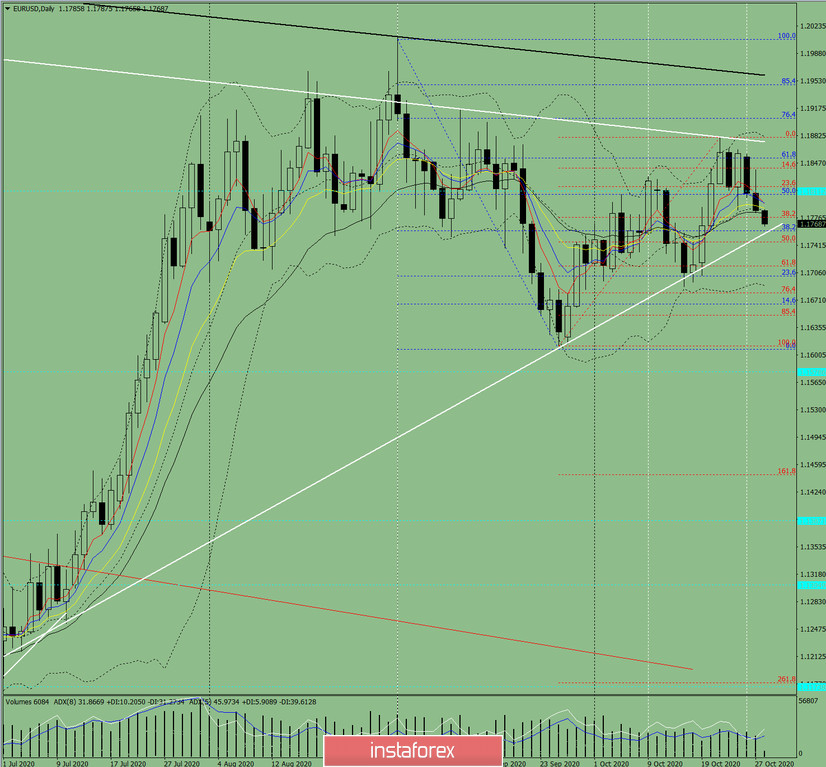
Figure 1 (Daily Chart)
Comprehensive analysis:
- Indicator analysis - down
- Fibonacci levels - down
- Volumes - down
- Technical analysis - down
- Trend analysis - down
- Bollinger Bands - down
- Weekly Chart - down
General conclusion:
Today, the price may continue to move down with the target of 1.1756 - the support line (white bold line). If this line is tested, further upward work is possible with the goal of 1.1807, which is the 50% pullback level (blue dotted line). From this level, it is possible to work upward.
Unlikely scenario: upon moving down and reaching the support line 1.1756 (white bold line), the price may start moving down to 1.1715 (red dotted line), which is the 61.8% pullback level.


