


To open long positions on EURUSD, you need:
In my morning forecast, I paid attention to the sale of the European currency after the breakout and consolidation below the level of 1.1761, which happened. Let's analyze the entry points and see where you can earn money. The 5-minute chart clearly shows how after breaking the level of 1.1761, the bulls tried to return the market to their side. However, the test of this area from the bottom up formed a new signal to open short positions in the continuation of the current downward trend, which led to a decrease in the pair to the support area of 1.1732. From this level, I recommended opening long positions immediately for a rebound in the expectation of a correction of 15-20 points, which happened.
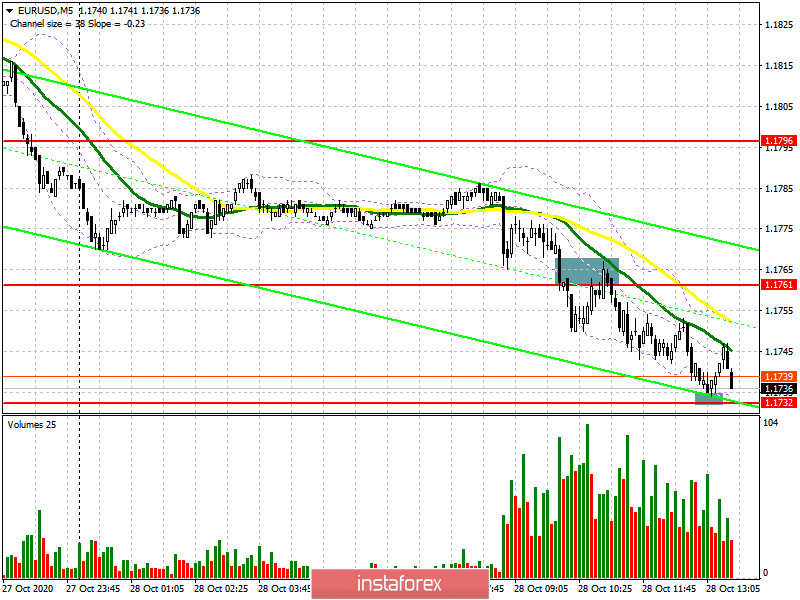
In the second half of the day, buyers will focus on protecting the support of 1.1732, as only the formation of a false breakout will be a signal to open long positions against the trend. If you re-test the area of 1.1732 and there is no activity on the part of buyers, I recommend that you postpone long positions in EUR/USD until you meet the minimum of 1.1704 and buy euros there immediately for a rebound based on the same correction of 15-20 points within the day. The absence of important fundamental statistics and tomorrow's meeting of the European Central Bank will be the main criteria for selling the euro. To return the market under their control, the bulls should make much more effort and climb above the resistance of 1.1761. Only a test of this level from top to bottom forms a good entry point into purchases to restore EUR/USD to the resistance area of 1.1796, where I recommend fixing the profits. There are also moving averages that play on the side of euro sellers.
To open short positions on EURUSD, you need to:
Sellers coped with the morning task and broke below the support of 1.1761, then easily reached the low of 1.1732. Now there is small profit-taking, however, the second test of this range may lead to a new wave of falling euros. I recommend opening short positions at weekly lows only after fixing EUR/USD below the support of 1.1732 and testing this level from the bottom up. Only in this case, we can expect a continuation of the downward trend to the area of the minimum of 1.1704, where I recommend fixing the profits. In the scenario of an upward correction of the pair in the second half of the day, it is best not to rush with sales, but to wait for the formation of a false breakout at the level of 1.1761. I recommend opening short positions in EUR/USD immediately for a rebound from the maximum of 1.1796, based on a correction of 15-20 points within the day.
Let me remind you that the COT report (Commitment of Traders) for October 20 recorded both the growth of long positions and the growth of short ones. However, the latter turned out to be more, which led to an even greater decrease in the positive delta. But despite this, buyers of risky assets believe in the continuation of the bull market, but prefer to proceed cautiously, as there is no good news on the Eurozone yet. Thus, long non-profit positions rose from the level of 228,295 to the level of 229,878, while short non-profit positions rose from the level of 59,658 to the level of 63,935. The total non-commercial net position fell to 165,943, down from 168,637 a week earlier. However, bullish sentiment for the euro remains quite high in the medium term. The stronger the euro declines against the US dollar at the end of this year, the more attractive it will be for new investors.
Signals of indicators:
Moving averages
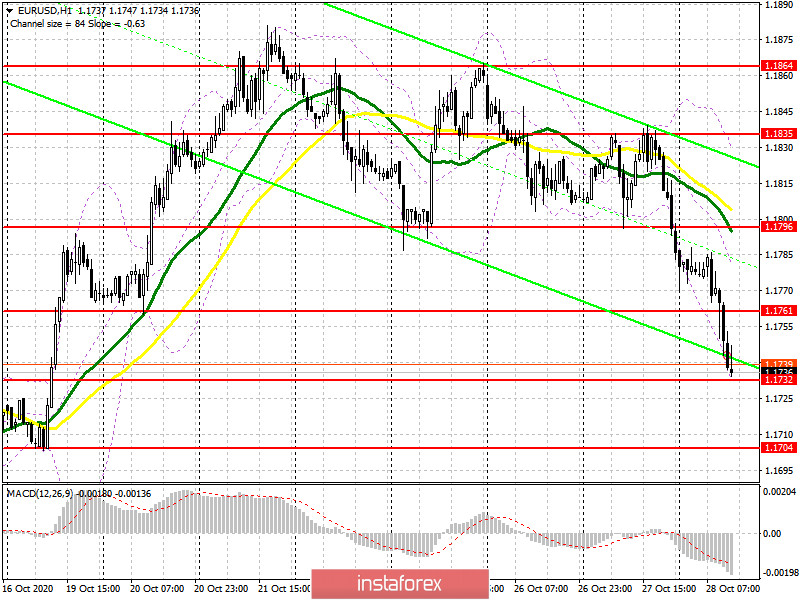
Trading is below 30 and 50 daily moving averages, which indicates a further decline in the euro.
Note: The period and prices of moving averages are considered by the author on the hourly chart H1 and differ from the general definition of the classic daily moving averages on the daily chart D1.
Bollinger Bands
In the case of an upward correction, the average border of the indicator around 1.1780 will act as a resistance where you can sell the euro.
Description of indicators
- Moving average (moving average determines the current trend by smoothing out volatility and noise). Period 50. The graph is marked in yellow.
- Moving average (moving average determines the current trend by smoothing out volatility and noise). Period 30. The graph is marked in green.
- MACD indicator (Moving Average Convergence / Divergence - moving average convergence / divergence) Fast EMA period 12. Slow EMA period 26. SMA period 9
- Bollinger Bands (Bollinger Bands). Period 20
- Non-profit speculative traders, such as individual traders, hedge funds, and large institutions that use the futures market for speculative purposes and meet certain requirements.
- Long non-commercial positions represent the total long open position of non-commercial traders.
- Short non-commercial positions represent the total short open position of non-commercial traders.
- Total non-commercial net position is the difference between the short and long positions of non-commercial traders.


