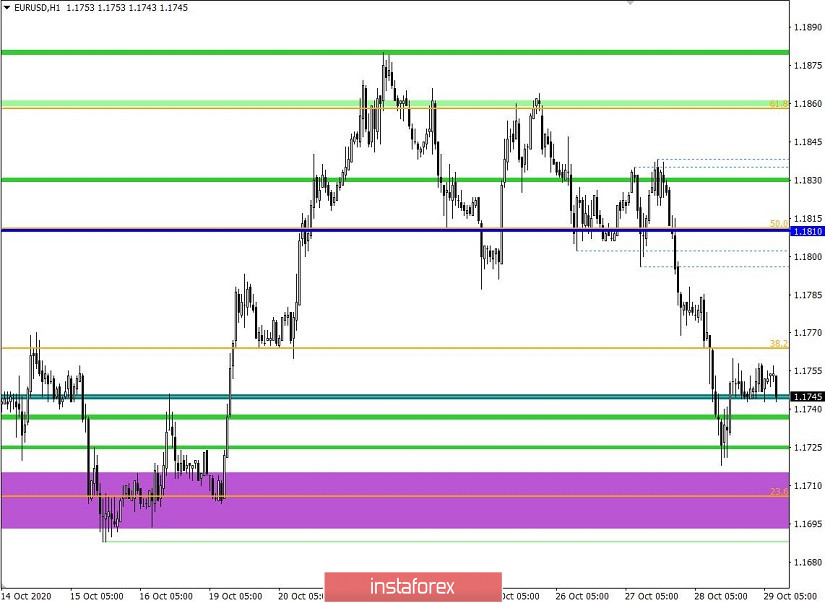
The EUR/USD pair showed an active downward interest yesterday. As a result, the quote rushed towards the interaction area of trade forces 1.1690/1.1700/1.1710, where it found a support near it. It was followed by a fluctuation in the form of a pullback, but at the same time, there was clearly a downward interest in the market.
The recovery relative to the scale of the four-week increase of 1.1612 - - - > 1.1880 is approximately 59%, which is already quite a lot, but the range level of 1.1700 will play a crucial role for subsequent short positions.
Speculative excitement rules the market, where traders carefully treat the information flow, since manipulations are made in the form of price surges based on it.
To keep up with speculators, you need to devote time to the information flow, where the hot topics are considered: COVID-19, Brexit and the US presidential election.
If we consider yesterday's fifteen-minute time frame, it can be seen that a round of short positions appeared at the start of the European session and lasted 11:30 UTC+00, where the quote reached the level of 1.1719. After that, there was a decline in the volume of short positions and a pullback towards the value of 1.1760, followed by accumulation within the limits of 1.1743/1.1760.
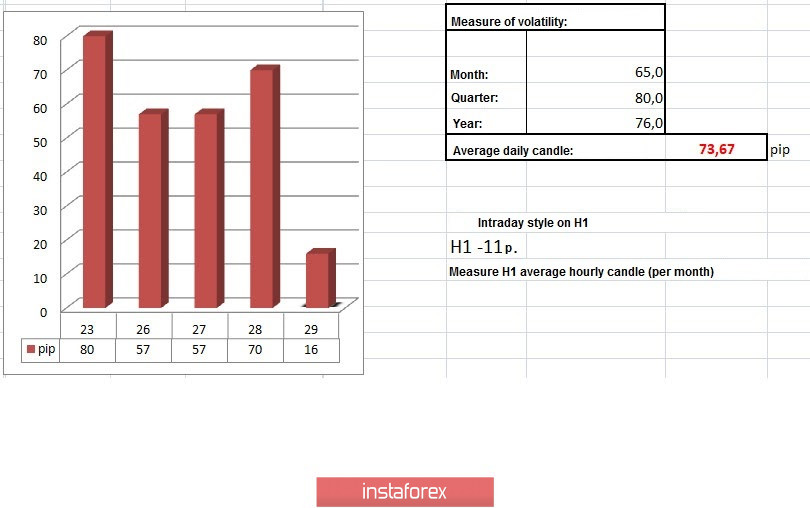
In terms of daily dynamics, an indicator of 70 points is recorded yesterday, which is 22% higher than on October 27 and 28. The acceleration is confirmed by the high speculative ratio in the market.
It was discussed in the past analytical review that holding the price below the level of 1.1760 would lead to a downward trend, which is what happened in the market.
Looking at the trading chart in general terms (daily period), we can see that the recovery process gives hope to sellers, but the main stage of the dollar strengthening will occur after the price consolidates below 1.1690, which could cause the breakdown of 1.1612 - the local high of September 25.
For the news background, there were no statistical indicators, but this did not become a problem for traders, since the information flow became the main lever of manipulation in the market.
So, in Europe, the highest cases of COVID-19 are recorded, where the heads of state are trying to literally cope with the second wave of infection.
German Chancellor, Angela Merkel, decided to strengthen restrictive measures during a meeting with the heads of regions. As a result, theaters, cinemas, fitness centers, beauty salons, hotels and public catering will be closed in the country from November 2.
In turn, French President, Emmanuel Macron introduced a nationwide quarantine, where from October 30 to December 1, public institutions, universities will be closed, private meetings, rallies will be limited, and cafes and restaurants will be closed. At the same time, kindergartens, schools, colleges and lyceums will remain open, but with tightened sanitary measures.
As you can see from the above material, the coronavirus inflow puts pressure on the European currency, which affects its exchange rate.

For the economic calendar, this is the most important day of the week. The ECB meeting will be held, where additional measures to stimulate the economy may be taken due to the worsening COVID-19 situation. Experts predict that the Pandemic Emergency Purchase Program (PEPP) will be expanded, and its term will also be extended.
Further development
Analyzing the current trading chart, you can see that there was a formation of stagnation in the limits of 1.1743/1.1760 during the Asian session, which will affect the accumulative process and the fastest acceleration in the market. We can assume that holding the quote below 1.1730 will lead to a local movement towards the 1.1690/1.1700/1.1710 area. The main volume of short positions will arise after the price consolidates below 1.1685 in the H4 TF.
As before, we pay special attention to the information flow from hot topics: COVID-19, Brexit and the US presidential election, where speculative surges in the market may occur depending on the rhetoric of the incoming information.

Indicator analysis
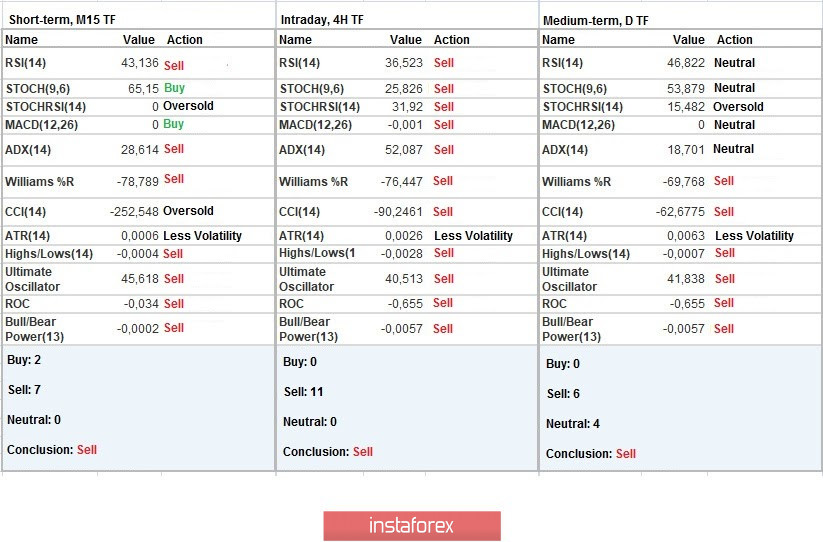
Analyzing different sectors of time frames (TF), it can be seen that the technical indicators on the minute and hour TFs have a sell signal due to the inertial outgoing move. The daily TF, in turn, confirms the recovery stage, signaling a sell.

Weekly volatility / Volatility measurement: Month; Quarter; Year
Measurement of volatility reflects the average daily fluctuation, calculated per Month / Quarter / Year.
The volatility of the current time is 16 pips, which is 78% below the average. It is very likely that an acceleration will occur due to the accumulation process, the ECB meeting, as well as negative information flow.

Key levels
Resistance zones: 1.1880; 1.1910; 1.2000 ***; 1.2100 *; 1.2450 **; 1.2550; 1.2825.
Support zones: 1.1700 1.1650 *; 1.1500; 1.1350; 1.1250 *; 1.1180 **; 1.1080; 1.1000 ***.
* Periodic level
** Range level
*** Psychological level


